Wednesday, January 17, 2024

MEMS-IMU error analysis


MEMS-IMU has many advantages over traditional IMUs, such as small size, low cost, low power consumption and high integration. MEMS IMU is widely used in the military field, such as tactical guided weapons. In recent years, the application scope of MEMS-IMU in the civilian field has been continuously expanded, such as drones, underwater equipment, car navigation, etc. At present, the performance indicators of MEMS inertial sensors at home and abroad cannot meet the requirements of inertial navigation. The performance indicators of the most advanced MEMS gyroscopes can only reach the tactical level, and they are easily interfered in the actual working environment, reducing the output accuracy. MEMS accelerometer performance is also inferior to traditional quartz accelerometers. This chapter will comprehensively analyze various errors and compensation solutions of MEMS-IMU.

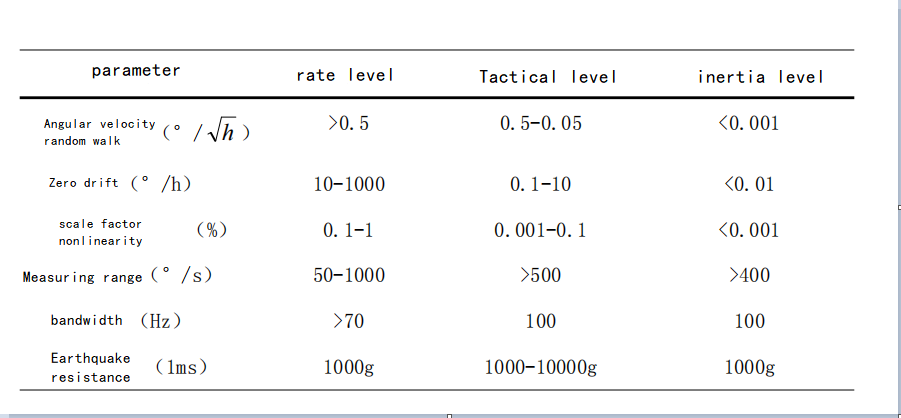
The following table shows the main indicators for judging gyroscope performance. Different grades have different accuracy levels.
The errors of MEMS-IMU mainly include errors of MEMS sensors and MEMS-IMU integration errors. The errors of MEMS IMU will be analyzed in detail from these two aspects below.
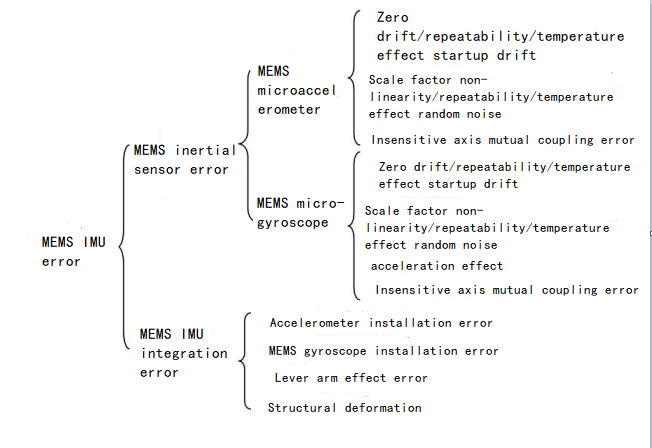
1.MEMS inertial sensor error analysis

1.1 Zero offset

The bias errors of MEMS accelerometers and MEMS gyroscopes mainly include bias, bias stability and bias repeatability. Zero-bias repeatability and zero-bias can be eliminated through initial alignment. Zero-bias stability refers to the degree of drift of its output angular velocity or acceleration over time under a certain input. This is related to the structure, design and external environment of the MEMS sensor.

1.2 Scale factor error

Since MEMS gyroscopes and MEMS accelerometers convert signals between signals through a scale factor, the error in the scale factor will directly affect the output error of the MEMS accelerometer and MEMS gyroscope. The error of the scale factor is divided into temperature drift and nonlinear error. It is difficult to measure the relationship between the scale factor and temperature through experimental testing for MEMS accelerometers, because centrifuges generally do not have temperature control devices, while MEMS gyroscopes can be temperature controlled. The relationship between the scale factor and temperature was measured using the turntable.

1.3 Non-sensitive axis coupling error

The non-sensitive axis coupling error refers to the error output caused by the non-orthogonality of the sensor structure itself when there is input on the non-sensitive axis. The non-sensitive axis mutual coupling error can be expressed by Equation

                                                                    Formula1:Insensitive axis mutual coupling error1-1

Among them, VX, VY, and VZ represent the output voltages of the x, y, and z-axis sensors, Input is the external input, and K is the mutual coupling error coefficient. It can be seen that the expression of the coupling error of the MEMS accelerometer and the MEMS gyro is the same as the installation error expression of the IMU can be processed together.

1.4 Acceleration sensitivity

The acceleration sensitivity of the MEMS gyroscope refers to the output of the MEMS gyroscope’s sensitive acceleration, which is an error term with a large impact. Because most MEMS gyroscopes are based on mechanical vibration, they may be affected by acceleration, especially in working environments with large accelerations. For example, when the acceleration of the carrier is 20g and the duration is 10s, when the acceleration sensitivity is 0.05 (° /s)/g, the angle error produced by this is approximately 10°. Such a large angle error has a great impact on the MEMS-IMU attitude solution, so acceleration sensitivity is an error term that cannot be ignored.

1.5 Random noise

The random noise of the structure and the random noise of the circuit are the main components of the random noise of the MEMS inertial sensor. The random noise of the structure is mainly mechanical thermal noise. The random noise of the circuit includes the thermal noise of the circuit, 1/f noise, shot noise and g-r. Noise, etc., the biggest impact on the performance of MEMS sensors is mechanical thermal noise and circuit thermal noise, which are the main research objects.

Brown’s force is the source of mechanical thermal noise. Its principle is that gas molecules or liquid molecules produce random collisions with mechanical particles. This effect directly affects the sensitivity and resolution of the MEMS sensor and increases the random noise during measurement. Because the structure of the MEMS sensor is on the micron or even nanoscale, the impact of molecular motion cannot be ignored.

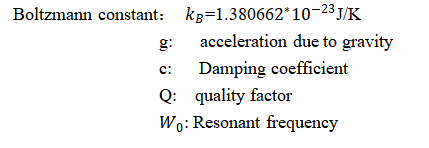
For capacitive MEMS inertial sensors, the equivalent Brown noise acceleration is

                                                                    Formula2:Equivalent Brown noise acceleration1-2

                                                                                                Formula3: 1-3 
 

Circuit thermal noise refers to the irregular thermal movement of carriers in a conductor when the temperature is above zero. Due to this irregular thermal movement, the current in the circuit deviates from the average fluctuation, resulting in voltage fluctuations. The power spectrum distribution of this thermal noise is

                                                                 Formula4: The power spectrum of thermal noise1-4

Among them, R is the resistance of the conductor. From the above formula, we can know that the power spectrum of random noise is constant in the entire frequency band. However, the noise can be suppressed through low-pass filtering to prevent it from spreading in the form of integrals in navigation and positioning.

2.MEMS-IMU integrated error analysis

Sensor mounting non-orthogonality errors and lever-arm effect errors are the main components of MEMS-IMU integration errors.

2.1 Sensor installation error

The sensor installation error of MEMS-IMU is mainly due to the non-orthogonality of the MEMS-IMU shell, the sensor installation error and the non-orthogonality of the sensor itself. As shown below.
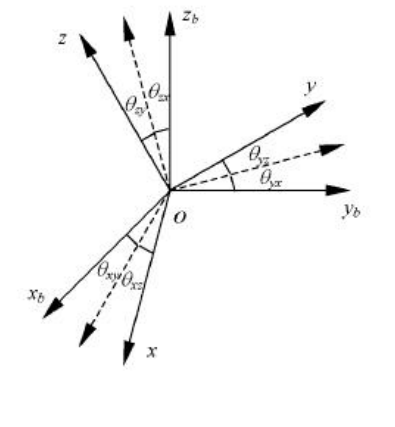
 where xByBzB is the reference orthogonal coordinate system, xyz is the coordinate system of the gyroscope group or accelerometer group, θij (i, j=x, y, z) represents the installation error angle, where i represents the measurement axis, j represents the measurement axis around j The installation error angle caused by shaft rotation is positive in counterclockwise direction. The transformation from the reference coordinate system to the axis coordinate system is as follows.


The form is consistent with the formula (1-1) and does not need to be distinguished. The installation error of the MEMS gyroscope can be evaluated using the turntable test method. Given different rotational speeds, the installation error angle parameters can be obtained by measuring the output at different rotational speeds. The static tumbling test method can be used to evaluate the installation error of the MEMS accelerometer, and the installation error angle parameters of the MEMS accelerometer can be solved by measuring the output at multiple positions.

2.2 Lever arm effect error

Since the sensor of the combined MEMS-IMU is installed separately, when the carrier rotates around a certain rotation axis, the sensor will be subject to additional centrifugal acceleration and tangential acceleration, resulting in output errors of the MEMS accelerometer and MEMS gyroscope. The error is related to the rotation angular rate. Directly proportional.


3 Calibration

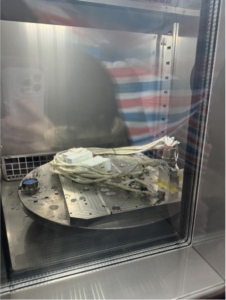
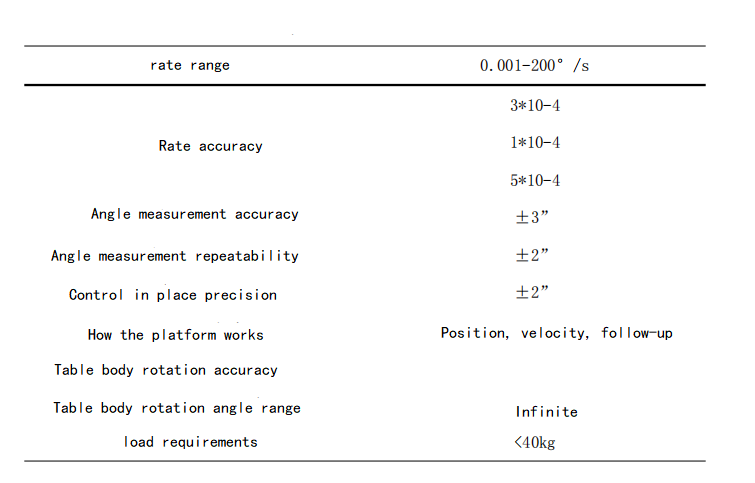
According to the above calibration method, the single-axis turntable can be used to complete the angular rate calibration experiment and position calibration of the MEMS gyroscope and MEMS accelerometer, and solve the various error coefficients in the error model. The experimental platform is shown in the figure, and the performance indicators of the experimental platform as follows.
4 Calibration method verification

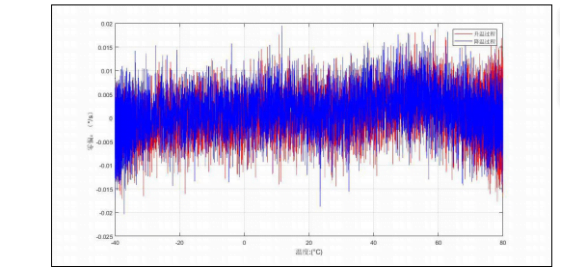
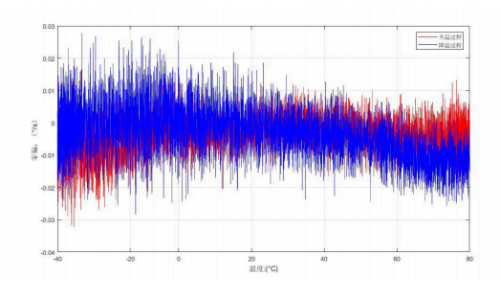
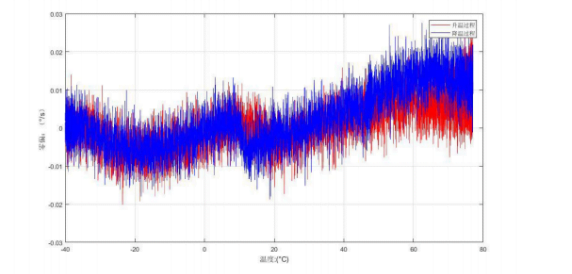
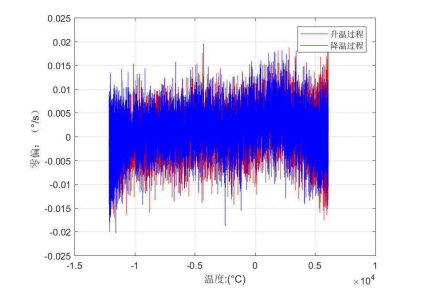
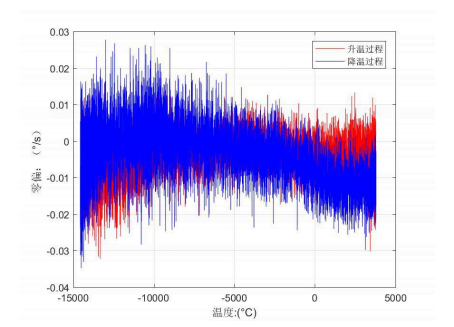
Use the obtained error coefficients to compensate the MEMS gyroscope and MEMS accelerometer, then install the MEMS-IMU on the turntable with the Z-axis facing upward and fix it, and control the temperature of the turntable to rise from -40° to 80°, and then from 80° ° drops to -40°, collect the output data of MEMS-IMU respectively and save them. Use MATLAB to draw the saved data into a graph, and the results are shown in the figure below.
   

                                                   Comparison of data before and after MEMS IMU compensation

As can be seen from the data before and after X-axis compensation in the figure above, the maximum output error of the gyro before compensation reached 0.025°/s, and after compensation it was reduced to 0.02°/s, and it can also be seen from the figure that the error is increasing. The data at 0.01°/s-0.025°/s is significantly reduced, and the errors in the Y and Z axes are also reduced. This shows that the calibration method in this article is feasible.

Summarize

Analyze various error sources of MEMS-IMU, including device errors and integration errors. Based on the main error sources of MEMS gyroscopes and MEMS accelerometers, corresponding error models were established, a calibration experimental plan was designed, and the calibration experimental plan was experimentally verified, confirming that the given calibration method is feasible and can improve MEMS-IMU measurement accuracy. Regarding the accuracy of MEMS IMU, I have to say that the MEMS IMU independently developed by ERICCO has high accuracy, small size, light weight and low power consumption. For example, the gyroscopes and accelerometers in ER-MIMU01 and ER-MIMU-02 are also more accurate. Strict measures have also been taken for the error calibration of the IMU.

If you want to learn about or purchase an IMU, please contact our relevant personnel.


https://www.ericcointernational.com/application/mems-imu-error-analysis.html

Tuesday, January 16, 2024

Research on Temperature Characteristics of Tilt Sensor


1. Influence of temperature on tilt sensor

Tilt sensor is widely used in various angle measurement, such as high precision laser instrument level, ship navigation attitude measurement, geological equipment tilt monitoring, satellite communication vehicle attitude detection. However, in the harsh working environment, the inclination sensor is easily affected by temperature, and there are zero point and sensitivity temperature drift.
Because the temperature of the working environment of the tilt sensor changes greatly, and the heat output caused by the temperature change will bring large measurement errors. At the same time, temperature changes also affect the size of zero and sensitivity values, and then affect the static characteristics of the sensor, so measures must be taken to reduce or eliminate the impact of temperature changes, that is, temperature compensation must be carried out.

2. Tilt sensor temperature compensation method
Inclination sensor temperature compensation methods are generally divided into hardware compensation method and software compensation method. Hardware compensation method is mainly achieved by changing device structure, material, working environment and technology to improve the reliability of measurement results. But in practical application, the working environment is bad, the structure of hardware compensation method is complicated and it is difficult to achieve the ideal effect. The idea of software compensation is to separate and compensate the error through experiment. Because the temperature error of tilt sensor is a nonlinear error, it is difficult to achieve a high compensation accuracy. RBF neural network has strong curve fitting ability. Compared with BP neural network, we use RBF neural network for temperature compensation of inclinometer sensor, which greatly reduces the influence of temperature on tilt sensor and achieves good compensation effect.

3. Temperature compensation based on radial basis function RBF neural network
3.1 RBF neural network compensation principle
RBF neural network is a kind of forward feedback-free network with excellent performance. It can approximate continuous function with arbitrary precision and has been widely used in pattern recognition, function approximation and so on. RBF neural network is composed of input layer, hidden layer and output layer. The hidden layer nodes are composed of Gaussian radial basis functions, as shown in equation (1) :

tilt sensor-Gaussian radial basis function

i=1,2,…,h (1)Where: ci is the center of the i-th basis function and has the same dimension as x; σi is the extension constant or width of the i-th basis function, and the smaller σi is, the smaller the width of the radial basis function and the more selective the basis function is. Neurons in the output layer adopt a linear activation function, and the output of the KTH neuron is shown in equation (2) :

Tilt sensor-output of the KTH neuron

Where: yk is the output of the KTH neuron in the output layer; W2ik is the connection weight of the I-th neuron in the hidden layer and the K-th neuron in the output layer.
In the parameter design of RBF neural network learning algorithm, it is generally necessary to design three parameters: data center of each basis function, expansion constant and weight of output node. We use K clustering algorithm to determine the basis function of the data center. Recursive least square method is used for the weight between hidden layer and output layer to ensure faster convergence speed.

3.2 RBF neural network temperature compensation results
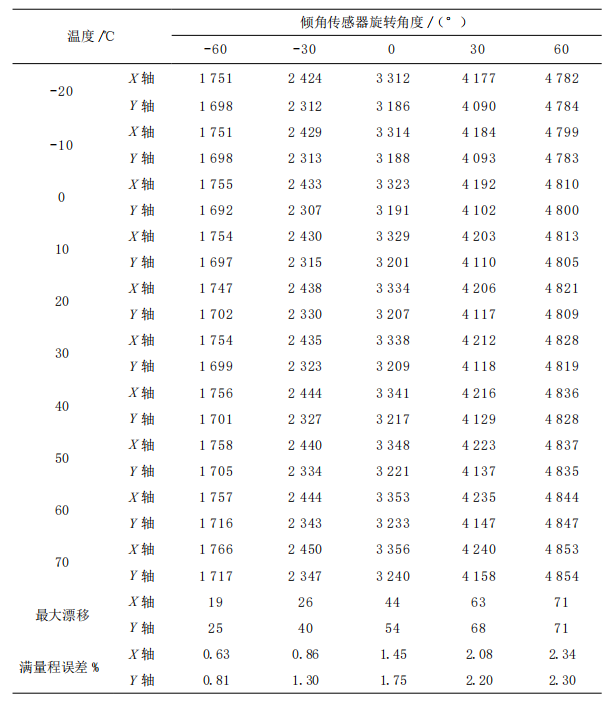
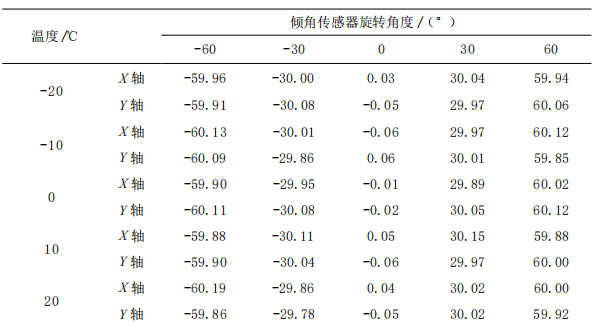
In the simulation experiment, the output value T1 of the inclination sensor and the temperature of the temperature box are taken as the input of the model, and the rotation Angle of the tilt sensor is taken as the output of the model. The 100 sets of data in the following table are samples of the RBF neural network two-input-output model.

Tilt sensor temperature experiment data recording

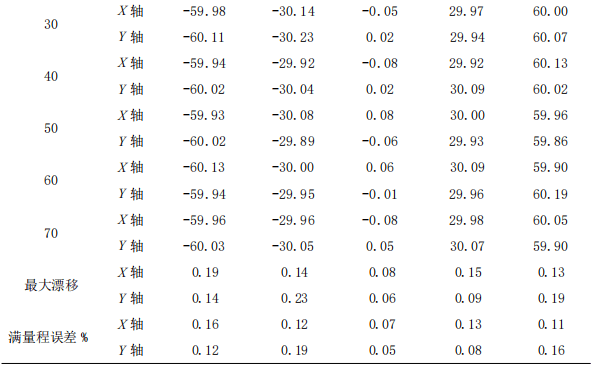
The input layer of the neural network is composed of two neurons, and the output layer is composed of one neuron. The number of hidden layer neurons is automatically added by the software through checking the output error until the error requirement or the maximum number of hidden layer neurons is reached. Through several experiments, the radial basis function distribution density SPREAD=0.5 and the training target error was set as EGOAL=1e-6. After 25 training sessions, the target training accuracy was achieved. Compensation results are shown in the following table.

tilt sensor-RBF neural network temperature compensation results1

tilt sensor-RBF neural network temperature compensation results

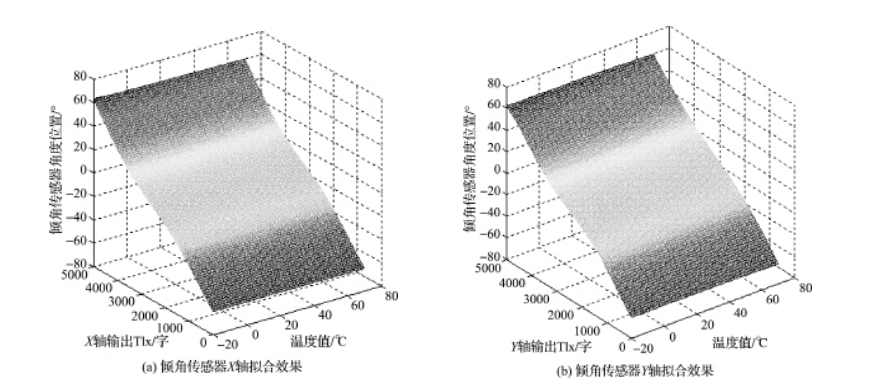
The output RBF neural network modeling graph is shown in the following figure

tilt sensor-Neural network fitting effect

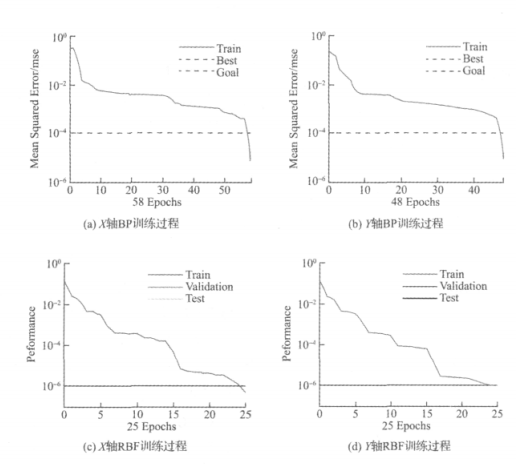
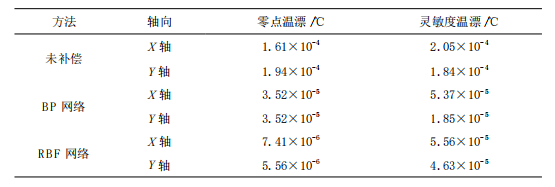
Comparing Table 1 and Table 2, it can be seen that the temperature drift and full scale error of each axis are greatly reduced after modeling by RBF neural network. As can be seen from the RBF network fitting effect diagram in FIG. 3, the simulation graphics transition smoothly at each point, and the model compensation effect is relatively ideal. In order to compare the compensation effect of the RBF network, we also set up the BP neural network compensation model which is often used for temperature compensation. The input layer of BP neural network is composed of two neurons and one implicit layer. After many experiments, it is determined that the optimal number of hidden layer is 5, and the output layer is composed of 1 neuron. The goal error of the training is EGOAL=1e^(-4), and the learning efficiency is LP.lr=0.2. In the experiment, 100 groups of samples in Table 1 were used to train the established BP network. After about 50 iterations, the training was completed. The training pairs of RBF and BP network were shown in the following figure.

Tilt sensor-Comparison of RBF and BP neural network training

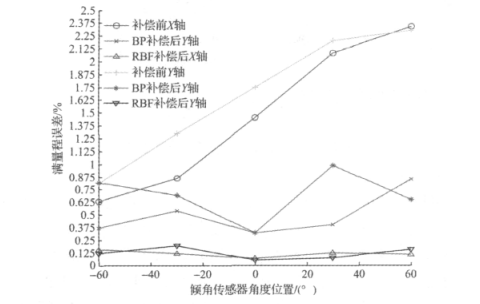
The target difference of BP neural network training is 1e^(-4), and that of RBF neural network training is 1e^(-6). However, the training time of RBF neural network is only about 1/2 of that of BP network, which shows that RBF convergence speed is relatively ideal. At the same time, the zero point temperature drift and sensitivity temperature drift before and after compensation are shown in following table. BP network and RBF network reduce the zero point and sensitivity temperature drift by 1 and 2 orders of magnitude respectively. The full scale error diagram of the inclination sensor under the action of -20~70℃ is shown in the figure below.

the zero point temperature drift and sensitivity temperature drift before and after compensation

full scale error diagram of the inclination sensor under the action of -20~70℃

The maximum full scale error before compensation is about 2.34%, after BP neural network modeling compensation is about 0.85%, and after RBF modeling compensation is reduced to 0.158%. The simulation results show that the output error of the tilt sensor decreases after temperature compensation, and the output error decreases from 2.8° before compensation to 0.23° after conversion to angle degree. The modeling effect of RBF neural network is much better than that of BP network model, and it is very close to the actual expected value. Therefore, for the inclination sensor in this paper, RBF neural network modeling compensation can obtain better compensation effect.

Concluding discussion
We use RBF neural network compared with BP network to realize the research of temperature compensation of inclination sensor. The experimental results show that the RBF neural network modeling compensation achieves good compensation results in this system: for zero temperature drift, the X-axis decreases from 1.61×10^(-4) before compensation to 7.41×10^(-6), and the Y-axis decreases from 1.94×10^(-4) before compensation to 5.56×10^(-4). For sensitivity temperature drift, the X-axis decreased from 2.05×10^(-4) before compensation to 5.56×10^(-6), and the Y-axis decreased from 1.84×10^(-4) before compensation to 4.63×10^(-6). The RBF neural network is used to compensate the temperature of the inclinometer sensor, which reduces the influence of temperature on the sensor, overcomes the disadvantage that BP network is easy to fall into local optimal, improves the stability and measurement accuracy of the system, and lays a foundation for the application of the inclination sensor in various industries.

For example, Ericco’s ER-TS-12200-Modbus and ER-TS-32600-Modbus, both of which are dual-axis monitoring, we can completely carry out temperature compensation through RBF neural network modeling, and after compensation, the zero temperature drift and sensitivity temperature drift value of X axis and Y axis will be greatly reduced. In this way, we can reduce or even eliminate the adverse effects of temperature on the inclinometer sensor. 

MEMS-IMU error analysis


MEMS-IMU has many advantages over traditional IMUs, such as small size, low cost, low power consumption and high integration. MEMS IMU is widely used in the military field, such as tactical guided weapons. In recent years, the application scope of MEMS-IMU in the civilian field has been continuously expanded, such as drones, underwater equipment, car navigation, etc. At present, the performance indicators of MEMS inertial sensors at home and abroad cannot meet the requirements of inertial navigation. The performance indicators of the most advanced MEMS gyroscopes can only reach the tactical level, and they are easily interfered in the actual working environment, reducing the output accuracy. MEMS accelerometer performance is also inferior to traditional quartz accelerometers. This chapter will comprehensively analyze various errors and compensation solutions of MEMS-IMU.

The following table shows the main indicators for judging gyroscope performance. Different grades have different accuracy levels.

The errors of MEMS-IMU mainly include errors of MEMS sensors and MEMS-IMU integration errors. The errors of MEMS IMU will be analyzed in detail from these two aspects below.

1.MEMS inertial sensor error analysis

1.1 Zero offset

The bias errors of MEMS accelerometers and MEMS gyroscopes mainly include bias, bias stability and bias repeatability. Zero-bias repeatability and zero-bias can be eliminated through initial alignment. Zero-bias stability refers to the degree of drift of its output angular velocity or acceleration over time under a certain input. This is related to the structure, design and external environment of the MEMS sensor.

1.2 Scale factor error

Since MEMS gyroscopes and MEMS accelerometers convert signals between signals through a scale factor, the error in the scale factor will directly affect the output error of the MEMS accelerometer and MEMS gyroscope. The error of the scale factor is divided into temperature drift and nonlinear error. It is difficult to measure the relationship between the scale factor and temperature through experimental testing for MEMS accelerometers, because centrifuges generally do not have temperature control devices, while MEMS gyroscopes can be temperature controlled. The relationship between the scale factor and temperature was measured using the turntable.

1.3 Non-sensitive axis coupling error

The non-sensitive axis coupling error refers to the error output caused by the non-orthogonality of the sensor structure itself when there is input on the non-sensitive axis. The non-sensitive axis mutual coupling error can be expressed by Equation

                                                                    Formula1:Insensitive axis mutual coupling error1-1

Among them, VX, VY, and VZ represent the output voltages of the x, y, and z-axis sensors, Input is the external input, and K is the mutual coupling error coefficient. It can be seen that the expression of the coupling error of the MEMS accelerometer and the MEMS gyro is the same as the installation error expression of the IMU can be processed together.

1.4 Acceleration sensitivity

The acceleration sensitivity of the MEMS gyroscope refers to the output of the MEMS gyroscope’s sensitive acceleration, which is an error term with a large impact. Because most MEMS gyroscopes are based on mechanical vibration, they may be affected by acceleration, especially in working environments with large accelerations. For example, when the acceleration of the carrier is 20g and the duration is 10s, when the acceleration sensitivity is 0.05 (° /s)/g, the angle error produced by this is approximately 10°. Such a large angle error has a great impact on the MEMS-IMU attitude solution, so acceleration sensitivity is an error term that cannot be ignored.

1.5 Random noise

The random noise of the structure and the random noise of the circuit are the main components of the random noise of the MEMS inertial sensor. The random noise of the structure is mainly mechanical thermal noise. The random noise of the circuit includes the thermal noise of the circuit, 1/f noise, shot noise and g-r. Noise, etc., the biggest impact on the performance of MEMS sensors is mechanical thermal noise and circuit thermal noise, which are the main research objects.

Brown’s force is the source of mechanical thermal noise. Its principle is that gas molecules or liquid molecules produce random collisions with mechanical particles. This effect directly affects the sensitivity and resolution of the MEMS sensor and increases the random noise during measurement. Because the structure of the MEMS sensor is on the micron or even nanoscale, the impact of molecular motion cannot be ignored.

For capacitive MEMS inertial sensors, the equivalent Brown noise acceleration is

                                                                    Formula2:Equivalent Brown noise acceleration1-2

                                                                                                Formula3: 1-3 


Circuit thermal noise refers to the irregular thermal movement of carriers in a conductor when the temperature is above zero. Due to this irregular thermal movement, the current in the circuit deviates from the average fluctuation, resulting in voltage fluctuations. The power spectrum distribution of this thermal noise is

                                                                 Formula4: The power spectrum of thermal noise1-4

Among them, R is the resistance of the conductor. From the above formula, we can know that the power spectrum of random noise is constant in the entire frequency band. However, the noise can be suppressed through low-pass filtering to prevent it from spreading in the form of integrals in navigation and positioning.

2.MEMS-IMU integrated error analysis

Sensor mounting non-orthogonality errors and lever-arm effect errors are the main components of MEMS-IMU integration errors.

2.1 Sensor installation error

The sensor installation error of MEMS-IMU is mainly due to the non-orthogonality of the MEMS-IMU shell, the sensor installation error and the non-orthogonality of the sensor itself. As shown below.

 where xByBzB is the reference orthogonal coordinate system, xyz is the coordinate system of the gyroscope group or accelerometer group, θij (i, j=x, y, z) represents the installation error angle, where i represents the measurement axis, j represents the measurement axis around j The installation error angle caused by shaft rotation is positive in counterclockwise direction. The transformation from the reference coordinate system to the axis coordinate system is as follows.


The form is consistent with the formula (1-1) and does not need to be distinguished. The installation error of the MEMS gyroscope can be evaluated using the turntable test method. Given different rotational speeds, the installation error angle parameters can be obtained by measuring the output at different rotational speeds. The static tumbling test method can be used to evaluate the installation error of the MEMS accelerometer, and the installation error angle parameters of the MEMS accelerometer can be solved by measuring the output at multiple positions.

2.2 Lever arm effect error

Since the sensor of the combined MEMS-IMU is installed separately, when the carrier rotates around a certain rotation axis, the sensor will be subject to additional centrifugal acceleration and tangential acceleration, resulting in output errors of the MEMS accelerometer and MEMS gyroscope. The error is related to the rotation angular rate. Directly proportional.


3 Calibration

According to the above calibration method, the single-axis turntable can be used to complete the angular rate calibration experiment and position calibration of the MEMS gyroscope and MEMS accelerometer, and solve the various error coefficients in the error model. The experimental platform is shown in the figure, and the performance indicators of the experimental platform as follows.

4 Calibration method verification

Use the obtained error coefficients to compensate the MEMS gyroscope and MEMS accelerometer, then install the MEMS-IMU on the turntable with the Z-axis facing upward and fix it, and control the temperature of the turntable to rise from -40° to 80°, and then from 80° ° drops to -40°, collect the output data of MEMS-IMU respectively and save them. Use MATLAB to draw the saved data into a graph, and the results are shown in the figure below.
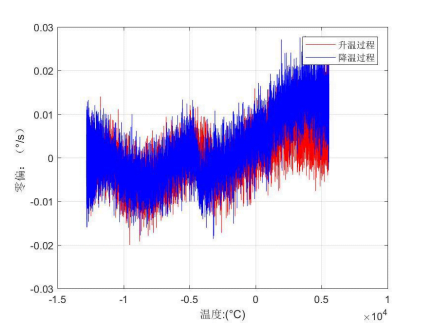
   

                                                   Comparison of data before and after MEMS IMU compensation

As can be seen from the data before and after X-axis compensation in the figure above, the maximum output error of the gyro before compensation reached 0.025°/s, and after compensation it was reduced to 0.02°/s, and it can also be seen from the figure that the error is increasing. The data at 0.01°/s-0.025°/s is significantly reduced, and the errors in the Y and Z axes are also reduced. This shows that the calibration method in this article is feasible.

Summarize

Analyze various error sources of MEMS-IMU, including device errors and integration errors. Based on the main error sources of MEMS gyroscopes and MEMS accelerometers, corresponding error models were established, a calibration experimental plan was designed, and the calibration experimental plan was experimentally verified, confirming that the given calibration method is feasible and can improve MEMS-IMU measurement accuracy. Regarding the accuracy of MEMS IMU, I have to say that the MEMS IMU independently developed by ERICCO has high accuracy, small size, light weight and low power consumption. For example, the gyroscopes and accelerometers in ER-MIMU01 and ER-MIMU-02 are also more accurate. Strict measures have also been taken for the error calibration of the IMU.

If you want to learn about or purchase an IMU, please contact our relevant personnel.


https://www.ericcointernational.com/application/mems-imu-error-analysis.html

Monday, January 15, 2024

Application of IMU in UAV Flight Control System

High Performance Navigation MEMS IMU

Nowadays, with the development of chip, artificial intelligence and big data technology, UAV has begun the trend of intelligence, terminal and clustering. A large number of professional talents in automation, mechanical electronics, information engineering and microelectronics have been invested in UAV research and development. In a few years, UAVs have flown from military applications far away from people’s vision to ordinary people’s homes. It is undeniable that the development of flight control technology is the biggest driver of UAV changes in this decade.

Flight control is the abbreviation of flight control system, which can be regarded as the brain of aircraft. The flight control system is mainly used for flight attitude control and navigation. For flight control, it is necessary to know the current status of the aircraft, such as three-dimensional position, three-dimensional velocity, three-dimensional acceleration, three-axis angle and three-axis angular velocity. There are 15 states in total. The current flight control system uses an IMU, also known as inertial measurement unit, which is composed of three-axis gyroscope, three-axis accelerometer, three-axis geomagnetic sensor and barometer. So what is a three-axis gyroscope, a three-axis accelerometer, a three-axis geomagnetic sensor, and a barometer? What role do they play in the aircraft? What are the three axes?

The three axes of the three-axis gyroscope, three-axis accelerometer and three-axis geomagnetic sensor refer to the left and right of the aircraft, and the vertical up and down in the front and back directions, which are generally represented by XYZ. The left and right directions in the aircraft are called roll, the front and rear directions in the aircraft are called pitch, and the vertical direction is the Z axis. It is difficult for a gyroscope to stand on the ground when it does not rotate. Only when it rotates, it will stand on the ground. This is the gyro effect. According to the gyro effect, smart people invented a gyroscope. The earliest gyroscope was a high-speed rotating gyroscope, which was fixed in a frame through three flexible axes. No matter how the outer frame rotates, the high-speed rotating gyroscope in the middle always maintains a posture. The data such as the degree of rotation of the external frame can be calculated through the sensors on the three axes.

Because of its high cost and complex mechanical structure, it is now replaced by the electronic gyroscope. The advantages of the electronic gyroscope are low cost, small size and light weight, only a few grams, and its stability and accuracy are higher than those of the mechanical gyroscope. Speaking of this, you will understand the role of gyroscope in flight control. It is used to measure the inclination of the three XYZ axes.

So what does the three-axis accelerometer do? It was just said that the three-axis gyroscope is the three axes of XYZ. Now it goes without saying that the three-axis accelerometer is also the three axes of XYZ. When we start driving, we will feel a thrust behind us. This thrust is acceleration. Acceleration is the ratio of speed change to the time of occurrence of this change. It is a physical quantity describing the speed of object change. Every second power of meter. For example, when a car is stopped, its acceleration is 0. After starting, it takes 10 seconds from 0 meters per second to 10 meters per second. This is the acceleration of the car, If the vehicle travels at a speed of 10 meters per second, its acceleration is 0. Similarly, if it decelerates for 10 seconds, from 10 meters per second to 5 meters per second, its acceleration is negative. The three-axis accelerometer is used to measure the acceleration of the three axes of the aircraft XYZ.

Our daily travel is based on landmarks or memories to find our own direction. The geomagnetic sensor is a geomagnetic sensor, which is an electronic compass. It can let the aircraft know its flight direction, nose direction, and find the position of the mission and home. The barometer is used to measure the atmospheric pressure at the current position. It is known that the higher the altitude, the lower the pressure. This is why people have plateau reactions after arriving at the plateau. The barometer obtains the current altitude by measuring the pressure at different positions and calculating the pressure difference. This is the whole IMU inertial measurement unit. It plays a role in the aircraft to sense the change of the aircraft attitude, such as whether the aircraft is currently leaning forward or left and right, What is the role of the most basic attitude data, such as nose orientation and altitude, in flight control?

The most basic function of flight control is to control the balance of an aircraft when flying in the air, which is measured by IMU, sense the current inclination data of the aircraft and compile it into an electronic signal through the compiler. The signal is transmitted to the microcontroller inside the flight control through the new time of the signal. The microcontroller is responsible for the calculation. According to the current data of the aircraft, it calculates a compensation direction and angle, and then compiles the compensation data into an electronic signal, It is transmitted to the steering gear or motor. The motor or steering gear is executing the command to complete the compensation action. Then the sensor senses that the aircraft is stable, and sends the real-time data to the microcontroller again. The microcontroller will stop the compensation signal, which forms a cycle. Most flight controls are basically 10HZ internal cycles, that is, 10 refreshes per second.

This is the most basic function application of IMU in the flight control system. Without this function, once an angle is tilted, the aircraft will quickly lose balance and cause a crash.

Ericco’s MEMS IMU ER-MIMU-03 and ER-MIMU-04ER-MIMU-07 and ER-MIMU-08 have built-in high-precision advanced MEMS gyroscopes and high-performance accelerometers, which can measure linear acceleration and angular velocity of rotation from three directions, and obtain carrier attitude, velocity and displacement information through analysis. They are specially designed for high-performance applications of inertial navigation equipment such as UAV flight control. Provides excellent stability in the temperature range of – 45° C to 80° C. The advanced gyro sensor design suppresses the linear acceleration effect of shock and vibration, enabling ER-MIMU-04, ER-MIMU-07 and ER-MIMU-08 to operate in harsh environments.

In addition to the application of ERICCO’s MEMS products in UAVs, its popularity in oil drilling, mining and other application markets is also growing. MEMS technology is developing into a huge industry. Just like the great changes brought to mankind by the microelectronics industry and computer industry in the past 20 years, MEMS has also bred a profound technological change, which has had a new round of impact on human society. 

If you want to purchase an IMU, please contact our relevant personnel.
Email: info@ericcointernational.com
WhatsApp: +8613992884879

High-precision IMU is coming to help in the fields of land, sea and air

  High-precision IMU is now widely used in many fields of sea, land and air. It can provide real-time and accurate information on the carrie...