Showing posts with label inclinometer sensor. Show all posts

Monday, May 20, 2024

What can a Tilt Sensor be Used for?


Classification of angles

Angle measurement is an important part of geometric measurement. Plane angle according to the spatial position of the plane can be divided into: horizontal angle (or azimuth angle) in the horizontal plane, vertical right angle (or inclination angle) in the vertical plane, space angle is the synthesis of horizontal angle and vertical right angle; According to the range can be divided into circular indexing angle and small angle; According to the nominal value can be divided into fixed angle and arbitrary angle; According to the component unit can be divided into line angle and plane angle; According to the formation method, it can be divided into fixed angle and dynamic angle. Fixed angle refers to the angle of components processed or assembled, and the angular position of the instrument when it is restored to static state after rotation. Dynamic angle refers to the angle of the object or system in the process of motion, such as the angle of the satellite orbit to the earth's equatorial plane, the axis angle drift when the spindle of the precision equipment rotates, and the real-time angle signal output when the angle measuring equipment moves at a certain angular speed and angular acceleration.

What is another name for a tilt sensor

Tilt sensor is also known as the inclinometer, inclination sensor, level inclinometer, often used in the measurement of the horizontal angle change of the system, the level from the simple bubble level in the past to the electronic level is the result of the development of automation and electronic measurement technology. As a testing tool, it has become an indispensable and important measuring tool in bridge construction, railway laying, civil engineering, oil drilling, aviation and navigation, industrial automation, intelligent platform, mechanical processing and other fields. Electronic level is a very accurate measuring small angle detection tool, it can be used to measure the inclination of the measured plane relative to the horizontal position, the degree of parallelism between the two components and the degree of perpendicularity.

The basic principle of tilt sensor (inclinometer)

how does tilt sensor works

The theory is based on Newton's second law: according to the basic principles of physics, inside a system, velocity cannot be measured, but acceleration can be measured. If the initial speed is known, the line speed can be calculated by integrating, and then the linear displacement can be calculated, so it is actually an acceleration sensor using the principle of inertia. When the tilt sensor is at rest, that is, there is no acceleration in the side and vertical directions, then the only force acting on it is the acceleration of gravity. The angle between the vertical axis of gravity and the sensitive axis of the acceleration sensor is the angle of inclination. The tilt sensor in the general sense is static measurement or quasi-static measurement, once there is external acceleration, then the acceleration measured by the acceleration chip contains the external acceleration, so the calculated angle is not accurate, therefore, the common practice is to increase the mems gyro chip, and adopt the preferred Kalman filter algorithm. The ER-TS-3260VO's built-in (MEMS) solid pendulum can measure changes in the static gravity field, convert them into changes in inclination, and output them through voltage (0~10V, 0~5V optional), so that the calculated angle is quite accurate.

Use

Tilt sensors are used in a variety of applications to measure angles. For example, high-precision laser instrument level, engineering machinery equipment leveling, long-distance ranging instruments, high-altitude platform safety protection, orientation satellite communication antenna elevation measurement, ship navigation attitude measurement, shield pipe application, dam detection, geological equipment tilt monitoring, artillery barrel initial launch angle measurement, radar vehicle platform detection, satellite communication vehicle attitude detection and so on.

Application example

Used in tower cranes

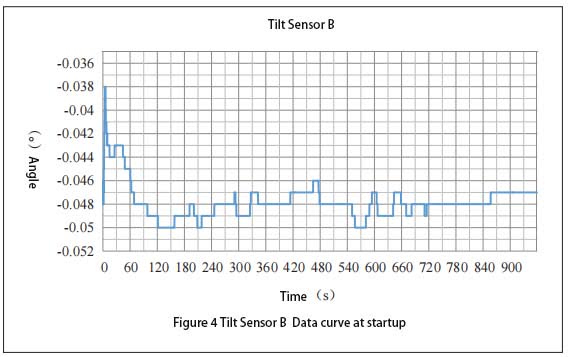
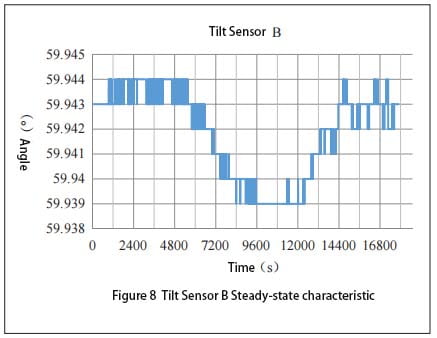
The inclination sensor is the main part of the anti-overturning monitoring instrument of tower crane. The function of the inclination sensor is to measure the angle of the tower tilt in real time. Since the tilt angle at the top of the tower is very small, the sampling frequency of the tilt sensor should be within the range of 0.5-10Hz, the measurement accuracy is higher than 0.05 degrees, and the noise caused by the vibration of the tower should be filtered out to ensure reliable communication and accurate judgment. The accuracy of the ER-TS-3160VO Voltage Single Axis Tilt Meter is 0.01 degrees, which is obviously higher than 0.05 degrees, and it is suitable for the tilt monitoring in this case.

Wednesday, April 17, 2024

Why is Tilt Sensor Used?


Tilt sensors are also known as inclinometers. They are a type of position sensor used to measure the Angle or slope of an object.

Inclinometers are one of the most common types of position sensors and are widely used in many industries.

1.Tilt sensor application

Tilt sensor Angle and slope. So anything that works on Angle will use a inclinometer sensor or a rotary position sensor.
Some sample applications include:
Robotics: Tilt sensors are used to sense the Angle of the robot arm to ensure that the arm movement is in a precise position.
Marine applications: inclinometer sensors are used in a variety of Marine applications, especially boom Angle sensing.
Industrial vehicles: In industrial vehicles, tilt sensors are used to monitor tip protection and for a variety of applications in cranes and construction vehicles.
Aerospace: tilt sensors are used for aircraft orientation and applications on the red arrow.
Industrial applications: Platform leveling is a popular application in the industrial sector that uses inclinometer sensors.
Safety: Tilt sensor Monitors security camera Angle sensing and mobile safety systems.
Mobile phones: Mobile phones are integrated with a very small tilt sensor that changes the orientation of the screen depending on how the phone is held.
Measure ski slope: for safety reasons.

2.How the tilt sensor works

There are different types of inclinometer sensors, and they work slightly differently.
A simple tilt sensor works by using a metal ball that connects two pins and moves within the sensor. When the sensor is tilted, the ball moves position, which connects the circuit that turns the sensor on or off.
More sophisticated inclinometer sensors use an internal gyroscope to measure the direction of the gravitational pull to determine the orientation of the device.

Ericco's tilt sensor is actually the use of MEMS plus meter in the static state can measure the principle of angular velocity. At present, there are conventional (single-axis), dynamic (two-axis), wireless inclinometer sensors, wired and wireless have their own advantages and disadvantages. We can choose the model according to the application scenario and accuracy requirements.

The single-axis ER-TS-3160VO, with an accuracy of 0.01°, is a very popular one with a wide range of applications. Is a very good choice, wireless ER-TS-12200-Modbus, accuracy up to 0.001°, is an ultra-low power, small volume, high-performance wireless inclinometer sensors, for industrial applications users do not need power supply or real-time dynamic measurement of object attitude Angle needs. Using lithium battery power supply, based on the Internet of Things technology Bluetooth and ZigBee(optional) wireless transmission technology, all internal circuits are optimized design, using industrial MCU, three-proof PCB board, imported cables, wide temperature metal shell and other measures to improve the industrial level of the product. Good long-term stability, zero drift small, can automatically enter low-power sleep mode, get rid of the dependence on the use environment. The product has compact structure, precise design, temperature and linearity compensation function, and integrates short-circuit, instantaneous high voltage, polarity, surge and other comprehensive protection functions, easy to use. Wireless digital signal transmission mode eliminates the tedious wiring and noise interference caused by long cable transmission; Industrial design has extremely high measurement accuracy and anti-interference ability. Wireless sensor nodes can form a huge wireless network, supporting thousands of measurement points to monitor the tilt at the same time, and support professional computer software. Without on-site investigation, it can measure and record the status of the tested object in real time. The safety monitoring system is suitable for remote real-time monitoring and analysis of industrial sites, dilapidated buildings, ancient buildings, civil engineering, various tower incline deformation and other needs.

3.Tilt sensor characteristics and specifications

The tilt sensor has the following characteristics;
High reliability
High accuracy
Easy to operate
Not using much electricity
Low cost
Small size, light weight, low power consumption
Anti-vibration, anti-impact, waterproof and dustproof
High stability, low noise, strong anti-interference ability

Different types of inclinometer sensors have different specifications to suit different applications. When choosing a tilt sensor, it is important to consider the following factors;
Sensitivity Some tilt sensors are more sensitive than others, depending on how the increment you need to measure affects the sensitivity of the desired sensor.
Axis number: The number of axes affects the Angle and direction that the sensor can measure.
Resolution: The resolution affects the minimum tilt that the sensor needs to detect.
Measuring range: What is the measuring Angle in the application? This will affect the type of sensor selected.
Accuracy: Different applications may require different degrees of accuracy, so it is important to choose a inclinometer sensors that reflects the requirements.
Noise tolerance: Our inclinometer sensors provide standard noise tolerance.
Certification: requires that we provide inclinometer sensors for intrinsically safe environments as well as underwater applications.

Friday, March 1, 2024

Static Capacitance Test of MEMS Tilt Sensor


1. Performance test content

The main indicators of the MEMS tilt sensor sensor chip include static capacitance, static performance test and dynamic performance test. The static performance test includes measurement range, sensitivity, linearity, transverse sensitivity and zero stability. The dynamic performance test is mainly the bandwidth test.

1.1 Static capacitance test
The static capacitance test was performed using wafer probe bench and Agilent 4294A impedance analyzer, as shown in Figure 4.10, mainly for screening MEMS tilt sensor sensitive chips before packaging.

Static capacitance test diagram

The specific steps of static capacitance test are as follows:
(1) The sensitive chip prepared by the lead pad is placed on the table of the probe table in the 0g state;
(2) The measurement mode of the impedance analyzer is set as impedance-frequency test, the sweep frequency range is 2kHz~3kHz, and the excitation source voltage amplitude is 0.5V;
(3) Adjust the two probe bases, and contact the probe with the top cover pad and the middle sensitive structure layer pad respectively to obtain the impedance-frequency test curve, as shown in FIG. 4.11 (a), and obtain the equivalent capacitance by fitting;
(4) Adjust the two probe bases again, and contact the probe with the bottom cover plate of the sensitive chip and the welding pad of the middle sensitive structure layer respectively to obtain the impedance-frequency test curve, as shown in Figure 4.11 (b), and obtain the equivalent capacitance by fitting.
It can be seen from the test that the static capacitance of the middle sensitive structure layer and the upper and lower cover plate of the sensitive chip is 5.24pF and 5.16pF respectively, which has a good symmetry.

Static capacitance test results

1.2 Static Performance testing
The static performance test of MEMS tilt sensor sensitive chip mainly includes range, sensitivity, linearity, lateral sensitivity and zero stability. The schematic diagram of static performance test is shown in Figure 4.12. Specific test methods and test results are as follows.
(1) Range, sensitivity, linearity test
① Test method
At room temperature in the laboratory, n Angle points are selected at basically equal intervals through the indexing head in the whole measurement range, corresponding to n acceleration value ai. Selection of + 90 ° range – 90 °, 75 °, 60 °, 45 °, 30 °, 15 °, 0 °, 15 °, 30 °, + + + 45 °, 60 ° +, + + 90 ° 75 °,; Plus or minus 30 ° range selection – 30 °, 25 ° ~ 20 °, 15 ° to 10 °, 5 °, 0 °, + 5 °, + 10 °, 15 ° + + 20 °, 25 °, 30 ° + +; ±15° Range selection -15°, -12.5°, -10°, -7.5°, -5°, -2.5°,
0°, +2.5°, +5°, +7.5°, +10°, +12.5°, +15°.
The input acceleration ai and the output value xi are linearly fitted using the least square method, and the fitting line is obtained as follows:

Minor square acceleration and output values

Static performance test schematic

② Test procedure
a. Install the MEMS tilt sensor sensitive chip test board on the precision optical indexing head, ensure that the sensitive direction of the sensitive chip is perpendicular to the rotating shaft of the indexing head, connect the power supply and serial data acquisition line;
b. After the installation is complete, power the test board, stabilize for 10 minutes, and use 0° near the zero position of the sensitive chip
And 180° two-point method to determine the mechanical zero position of the sensitive chip.
c. According to JJF 1427-2013 “Micro-electromechanical (MEMS) line accelerometer calibration specification”, the range, sensitivity,
Linearity test.
③ Test results
FIG. 4.13 (a) ~ (c) shows the sensitive characteristic curves of the MEMS tilt sensor sensor sensor in the range of ±90°, ±30° and ±15°, respectively. The linear fitting curves and residual errors are obtained by least square fitting of the curves, and the linearity results are obtained by equations (4.4) and (4.5). Detailed test results are shown in Appendix A, Schedule A.1~ Table A.3.

Static input output curve

According to the static input and output curve of the sensor sensor chip, the sensitivity of the sensor sensor chip can be obtained as
477716LSB/g, since the corresponding capacitance range of the AD7745 is ±4pF in the 24-bit digital quantity variation range (16777216 LSB), it is calculated that the actual capacitance-acceleration sensitivity of the sensor sensor chip is about 0.228pF/g. In the range of ±90°, the linearity of acceleration is 0.19%FS, and the linearity of Angle is 0.22°. In the range of ±30°, the acceleration linearity is 0.11%FS and the Angle linearity is 0.06°. The acceleration linearity in the ±15° range is 0.06%FS and the angular linearity is 0.017°. These indexes can meet the requirements of conventional industrial inclination measurement.
(2) Lateral sensitivity test
① Test method
Put the sensor sensitive chip in the horizontal state, coincide with the rotation axis of the indexing head, rotate the indexing head in the clockwise (or counterclockwise) direction, take the equal Angle θ=30°, and test in 7 angular positions, that is, θi=0°, 30°, 60°,…… 180°, record the output value Ei1 at each position and the output value Ei2 at each position when the sensor sensor chip is flipped 180°. The lateral sensitivity of the sensor sensor chip can be obtained according to the formula (4.6).

Lateral sensitivity of sensor sensitive chip

Where, TSR is the cross sensitivity, S is the sensitivity, Ei1 is the output value at θi, Ei2 is the output value after flipping 180° relative to θi, and g is the acceleration of gravity. The maximum TSR calculated is the transverse sensitivity of the sensor sensor chip.
② Test procedure
a. Install the MEMS tilt sensor sensitive chip test board on the precision optical indexing head, ensure that the sensitive direction of the sensitive chip coincides with the rotation axis of the indexing head, and connect the power supply and serial data acquisition line;
b. After installation, supply power to the test board, stabilize for 10 minutes, and determine the mechanical zero position of the sensitive chip by using the 0° and 180° method near the installation zero position of the sensitive chip.
c. Perform lateral sensitivity test according to JJF 1427-2013 “Microelectromechanical (MEMS) Line accelerometer Calibration Specification”.
③ Test results
According to the above test methods and test steps, the lateral sensitivity of the MEMS tilt sensor sensor chip can be obtained
The degree is 5.2%FS, and the specific test data are shown in attached Table A.4. The index is still not ideal, the main reason is that the current package shell size is large, the sensitive chip mounting no reference, it is easy to lead to mounting deviation Angle, resulting in sensitive direction sensitivity of the sensitive chip leakage in the non-sensitive direction, which has a direct impact on the horizontal sensitivity index.
(3) Zero stability test
① Test method
Set the sensitive direction of the sensor sensor chip to the horizontal state, coincide with the rotation axis of the indexing head, and record the output value of the prototype E1, E2, E3,…… EN, calculate the zero stability of the sensitive chip according to formulas (4.7) and (4.8).

Calculate the zero stability of the sensitive chip

Where, K1 is the sensitivity of the sensor sensitive chip, which is 477716LSB/g according to the previous test results, and σ is zero stability.
② Test procedure
a. Install the MEMS tilt sensor sensitive chip test board on the precision optical indexing head to ensure the sensitive chip
The sensitive direction is perpendicular to the rotating shaft of the indexing head, and the power supply and serial data acquisition line are connected.
b. After installation, supply power to the test board, stabilize for 10 minutes, and determine the mechanical zero position of the sensitive chip by using the 0° and 180° method near the installation zero position of the sensitive chip.
c. Conduct zero stability test according to JJF 1427-2013 “Micro-electromechanical (MEMS) Line Accelerometer Calibration Specification”, test time 1h.
③ Test results
The test results of zero stability are shown in Figure 4.14

Zero stability test results

2. Summary
The calculation shows that the 1h zero stability of the sensor chip is about 81.3μg, which can meet the requirements of conventional industrial inclination measurement. Ericco’s ER-TS-3160VO and ER-TS-4158CU, which we have tested for static performance, have a high level of protection and can work in harsh industrial environments for a long time. 

Tuesday, February 20, 2024

How to Improve Accuracy of Tilt Sensors


1. Methods to improve the accuracy of tilt sensor

As a very important physical quantity, Angle has a very important position in various fields such as industry, military and aviation, so its measurement is extremely important, and Angle measurement is an important part of metrology science. Tilt sensor is a device to measure the inclination Angle, it is an important link to realize the inclination measurement and automatic control, and its accurate and high-precision measurement becomes the most important thing, so it is necessary to study the algorithm to improve the measurement accuracy.
The research and implementation of the algorithm to improve the accuracy of the tilt sensor are obtained on the basis of practice. The method is based on the arcsine Angle output principle of the tilt sensor. Through repeated data processing and comparison of the old and new error values in the test, the appropriate correlation coefficient is finally obtained, so as to improve the accuracy.

2. Measurement preparation
Measuring the accuracy of biaxial tilt sensor is mainly divided into several steps: making test circuit board, compiling program, building test platform, data acquisition, data analysis and calculation. First of all, it is necessary to make a test circuit board, which is mainly made of dual-axis tilt sensor, single-chip microcomputer, analog-digital converter, MAX232 and other related components.
When the test circuit board is made, it is necessary to use the burner and related software to burn the test program in the single chip microcomputer, as shown in Figure 1. The test circuit board with sensor is fixed on the three-axis turntable, and the circuit board is connected to the computer that collects data, so as to form a complete test device, as shown in Figure 2.

tilt sensor complete test device structure diagram

tilt sensor output value acquisition tool

3. Measurement process
After the preparation work is completed, the measurement begins. Along with the rotation of the central axis and the internal axis of the three-axis turntable, the two-axis tilt sensor has the corresponding output value. We collect the data and save it on the computer. After that, the output value is processed, and the output value after data processing is compared with the rotation Angle of the turntable to calculate the accuracy of the sensor. Because the data processing of the central axis and the internal axis is the same, the central axis is introduced here as an example. After many calculations and measurements, the most suitable coefficient is selected to meet the requirements of high precision.
Since the measurement range of the biaxial tilt sensor we selected is between -30℃ and +30℃, here we set the minimum Angle of rotation of the turntable to 5°. Rotation Angle are respectively - 30 °, 25 °, and 20 °, 15 °, and 10 °, 5 °, 0 °, + 5 °, + 10 °, + 15 °, + 20 °, 25 °, 30 ° +, will these values are expressed in Ai. Each time the turntable is rotated, the output value of the sensor is recorded by relevant software, as shown in Figure 3. Among the many output values each time, the minimum and maximum values are recorded, and the data is saved to the computer, as shown in Table 1.

Table 1 Sensor output values

Taking the data at 0° as the benchmark, the output values Ci, Di, Ei and the difference between each output value and the set value Ai Cj, Dj, Ej were calculated using the corresponding formulas

Output value of each formula

The calculated data table is shown in Table 2.

Output value and difference after calculation

Curve fitting was performed on Cj, Dj and Ej, as shown in Figure 4.

Fitting diagram of error curve

According to the value 1026 corresponding to 0°, the output value is converted into an Angle, the evaluation test and multiple measurements are carried out. Finally, the optimal values 1028 and 1639 are selected, and the output values Ci, Di, Ei and the difference between each output value and the set value Ai Cj, Dj, Ej are calculated by using the corresponding formulas.

The formula value after many measurements

The calculated data table is shown in Table 3. Curve fitting was performed on Cj, Dj and Ej, as shown in Figure 5.

Table 3 Output value and difference after calculation

4 Summary
Through measurement and data processing, the requirements for improved accuracy are finally met. As can be seen from Figure 5, the measurement error of the biaxial inclinometer sensor has reached (-0.15~+0.17). To meet higher requirements, the algorithm needs to be further improved.

Figure 5. Error curve fitting diagram

For our biaxial inclinometer sensors, such as ER-TS-4250VO and ER-TS-4258CU, we can obtain the appropriate correlation coefficient by repeated data processing and comparing the old and new error values in the test through the above algorithm, so as to improve the measurement accuracy of the sensor. 

Tuesday, February 6, 2024

Analysis of Influencing Factors of Measurement Error of Tilt Sensor


1. Measurement accuracy of tilt sensor

The measuring accuracy is the measuring error range of the instrument. Measurement error and error is the basic problem of measurement test, any measurement will inevitably have measurement error, all the measured values are approximate values. Due to the influence of instruments, experimental conditions, environment and other factors, the measurement results can not be absolutely accurate, there will always be a large or small error between the measured value and the objective actual real value, and the range of this error is the accuracy of the measurement.
The tilt sensor has been used as an Angle measuring device to measure the relative sea level of objects for more than 100 years. From the traditional bubble type level, to the current acceleration principle or electrolyte principle and liquid capacitance principle, has been developed very mature, product accuracy continues to improve, the application field is gradually extensive and professional, manufacturers are also very many. However, the description of accuracy of most tilt sensors on the market is vague or there is a certain deviation. Generally speaking, according to the metrology law and relevant national/international standards, the description of accuracy has a general and deterministic description, but these descriptions are universal, whether they are suitable for the field of tilt sensors, there is no clear conclusion. First of all, we need to analyze the factors that affect the measurement accuracy of the tilt sensor, and then discuss how to determine the definition of the accuracy of the tilt sensor. Take the Angle sensor of acceleration principle as an example. It is the measurement of gravitational acceleration on the sensitive axis of the acceleration sensor into Angle data, that is, the Angle value and the acceleration value into a sine relationship. This principle is fully explained in many literature and product descriptions.

Factors affecting measurement error of tilt sensor

2. Indicators that affect the measurement accuracy of the inclinometer sensor

2.1 Sensitivity error - Sensitivity is used to describe the relationship between the input and output of the instrument, the input and output of the sensor are respectively used as the horizontal and vertical axis of the rectangular coordinate system, and the corresponding points of the ideal input and output values are connected into a curve, the slope of the curve is the sensitivity. The error value depends on the characteristics of the core sensor, but it is also related to the response frequency.

2.2. Zero bias - that is, when the input value is zero, the output value is not zero. The error depends on the characteristics of the core sensitive device itself, which means that in the case of the sensor without Angle input (absolute horizontal plane), the output Angle value measured by the sensor is not zero, and the output Angle value is zero offset.

2.3. Nonlinear error - the actual input and output value relationship curve does not coincide with the theoretical input and output value relationship curve, and cannot be made to coincide by translation, such errors are called nonlinear errors. The general expression method of its magnitude value is maximum error/range, that is, when the input reaches the maximum range, the output error is divided by the maximum range.

2.4. Horizontal axis error - refers to the error caused by coupling to the output signal of the sensor when the sensor applies a certain acceleration perpendicular to its sensitive axis or tilts at a certain Angle. For example, for a single-axis tilt sensor with a measuring range of ±30° (assuming that the X direction is the inclination direction of the inclination measurement), when a tilt of 10° occurs in the space perpendicular to the X direction (at this time, the tilt Angle of the actual measured X direction remains unchanged, such as +8.505°), The output signal of the sensor will cause an additional error due to this 10° tilt, which is called the cross-axis error. This extra error varies depending on the product. When the horizontal axis error of the inclinometer sensor is 3%FS, the additional error generated is 3%×30°=0.9°, and the actual output Angle of the sensor is simply estimated to be 9.405°(=8.505°+0.9°). At this time, even if the nonlinear error of the inclinometer sensor reaches 0.001°, relative to the horizontal axis error, this nonlinear error can be ignored, that is, as the measurement accuracy of the inclinometer sensor, the horizontal axis error cannot be counted, otherwise it will cause a large measurement error.

2.5. Allow the input shaft non-coincidence degree - refers to the sensor in the actual installation process, allow the sensor horizontal (Z direction) installation deviation, the index actually includes the input shaft non-alignment, vertical axis non-alignment error of two aspects. Generally speaking, the inclination direction of the inclinometer sensor is required to be parallel or coincide with the specified edge of the sensor when it is installed, which indicates that a certain installation Angle deviation can be allowed without affecting the measurement accuracy of the sensor. When the sensitive axis of the inclinometer sensor does not coincide with the actual tilt direction, the extra error is sinusoidal with the increase of the tilt Angle. The actual test shows that when the Angle between the sensitive axis of the inclinometer sensor and the actual inclination direction is more than 3°, for the linear error of the inclinometer sensor with the range of ±30° ±0.01°, the additional error will reach ±0.3~0.5°, which is much larger than the nonlinear error.

2.6. Repeated measurement accuracy - that is, when a value is repeatedly measured, the output value is not fixed to the same value, there will be random fluctuations, or in line with a random distribution. The error value depends on the characteristics of the core sensitive device and cannot be improved by subsequent correction measures.

2.7. Effect of temperature on zero point and sensitivity - also includes drift and repeatability of the temperature curve, which depends on the own characteristics of the core sensitive device and cannot be improved by subsequent correction measures. In the case of repeatability, it can be corrected later, depending on the number of correction points (Angle points and temperature points). The more correction points, the better the temperature drift accuracy.

3 Summary
It can be seen that the system errors of ER-TS-3160VOER-TS-4250VO and ER-TS-4258CU include sensitivity error, zero bias, repeatability and temperature drift repeatability, which cannot be corrected and compensated. Random error includes horizontal axis error, input axis misalignment, nonlinearity, temperature drift linearity, which can be improved by correction and compensation measures. Their resolution has nothing to do with accuracy, so they cannot be included in the accuracy index.
Therefore, the measurement accuracy of the inclinometer sensor must not be measured only by nonlinearity, and it is necessary to synthesize the systematic error and random error of the sensor. 

Thursday, February 1, 2024

Stability Test and Analysis of Tilt Sensor


As a kind of angle measuring instrument, tilt sensor is widely used to measure the vertical angle of missile launching guide rail and the attitude measurement of engineering equipment.

In practical applications, the measurement focus of inclinometer sensor is stability measurement, so improving the stability of inclinometer sensor measurement becomes the most important thing. Because the external temperature has a great influence on the stability of the sensor, we focus on the test and comparative analysis of the working stability of the two tilt sensors in the field environment.
During the test, two inclinometer sensors using the same accelerometer were selected in the same field environment, and their starting characteristics, static stability and dynamic following were tested. Experimental data of the two sensors were collected and compared.

1. Sensor stability test
In the stability test of tilt sensor, according to the use of the tilt sensor on the installed equipment, this paper focuses on the test of the start-up characteristics, dynamic following and static stability of the tilt sensor. The measurement accuracy of the two inclinometer sensors selected for testing in this paper is 0.016°, and the inclination Angle of the test equipment is 60°. Before starting, the inclination sensor is in the horizontal state. The two tilt sensors selected during the test are named Sensor A and Sensor B.

1.1 Test Purpose
After a series of tests, the start-up, dynamic following and steady-state characteristics of the inclinometer sensor are obtained, which are easy to form charts for analysis.
1.2 Test Equipment 
The two inclinometer sensors selected in this paper are finished products, which are applied to the mechanical equipment to be tested as test equipment.
1.3 Test Environment
Because the test data obtained by the two sensors needs to be compared, the test environment of the two sensors is placed in the same place at the same time, that is, the test equipment is placed at the site where the device is used.
1.4 Test Platform
The tests were mainly conducted on two vertical devices. In the test process, firstly, the selected two inclinometer sensors are installed in the installation position of the test equipment and installed according to the sensor instructions; After that, power and communication checks are carried out on the inclination sensors to ensure that the two sensors can work normally. Finally, the test is carried out according to the test steps, and the output data in the whole process of sensor test is recorded.
1.5 Test Content
This paper mainly tests the starting characteristics, dynamic following and steady state characteristics of the two tilt sensors, that is, the normal use process of the test equipment. Since the entire process of using the sensor on the test device is tested, the test will be divided into three phases and conducted several times.
1.6 Test Procedure
The whole test process is relatively simple, and the test step flow is shown in Figure 2.

tilt sensor Flowchart of the test steps

1.7 Test data analysis
Since the inclinometer sensor is tested in a field environment, it is necessary to consider the temperature change of the environment. In this paper, the field environment temperature change curve is simulated as a sine curve, as shown in formula (1) :
f(t)=ksin((t×2π)/T) (1)
Where, t — time, the value is the test time point;
k — the difference between the highest and lowest temperature of the day, which in this paper takes the value of 24 ° C;
T — Time period, the value is 24 h. The test was conducted during the day, and the rate of temperature change was faster, so
We take the derivative of f(t). By substituting the values obtained in the test into the derivation formula, the fastest temperature change rate can be obtained, that is, 0.1 ℃/min.

1.71 Testing Startup features
The equipment equipped with the inclination sensor is placed on the test site, and the measuring part of the sensor is placed in the horizontal state. At this time, the sensor is operated with power off. Power on the sensor two hours later and record the data generated within one hour after the sensor is powered on. Figure 3 shows the data curve of A and Figure 4 shows the data curve of B. It can be seen from Figure 3 that the Angle measurement value of A is 0.002° within 1 minute of power-on; The measurement value fluctuates from 0.001° to 0.002° and changes rapidly after 1 to 5 minutes of power-on. The measurement error is 0.001°. From 5 minutes to 14 minutes of power-on, the measured value fluctuates between 0.001° and 0.002°, while the fluctuation frequency is low, and the measurement error value is 0.001°. The measured value is stable after 14 minutes of power-on. It can be seen from the above that the Angle sensor selected in the test gradually stabilizes after 1 minute of power-on start-up. As can be seen in FIG. 4, the Angle measurement value of B is -0.048° after 15 minutes of power-on and start-up, the output measurement value reaches a steady state, and the measurement error value is 0.001°. The measurement value between 4 minutes and 15 minutes is -0.048°, and the measurement error is 0.002°. The measurement value between 1 minute 30 seconds and 4 minutes is -0.049°, and the measurement error value is 0.001°. The measured value is -0.048° within 1 minute and 30 seconds after power-on. The measurement error is 0.002° between 1 minute 30 seconds and 15 minutes after power-on and start-up, and then reaches stability.
The comparison between FIG. 3 and FIG. 4 shows that A reaches the stable state faster than B during power-on start-up; For A period of time after reaching stability, the measurement error of A is smaller than that of B.

Tilt sensorA Data curve at startup

Tilt Sensor B Data curve at startup

1.72 Dynamic characteristic test
The Angle sensor is powered on and started. After the output measurement value is stable, the installation position of the vertical Angle sensor is raised. When the output data of the tilt sensor is obtained, the output measurement data of the sensor will be obtained to generate a curve. In addition, the parameters of device erection are obtained from the sensor mounting device, and the motion curve of the device erection is generated. The lag Angle data of the measured value of the sensor can be obtained by making A difference between the two curves. The lag curve of A is shown in Figure 5, and the lag curve of B is shown in Figure 6. As can be seen in Figure 5, the device is in a horizontal state before 35 s, and performs vertical action between 35 and 43 s. After 43 s, the sensor enters a stable state again. At 35 s, the device changes from a static state to a dynamic state, the hysteresis curve bulges downward, and the measured value of the sensor follows the device with good dynamic following. After that, the hysteresis of the sensor gradually increases, and the hysteresis reaches a maximum of 4.5° between 41 and 42 s. Finally, the Angle lag value becomes smaller and gradually becomes zero.
As can be seen from FIG. 6, the erecting process of B is the same as that of sensor A. When the device is erecting at 35s, the measured value of the sensor does not follow the sensor. After the device is erecting at A certain Angle, the measured value of the sensor will change the output, and the lag reaches a maximum of 3° between 41 and 42s. Finally, the angular lag value becomes smaller and gradually becomes zero.
The comparison between FIG. 5 and FIG. 6 shows that sensor A has better dynamic tracking performance than sensor B. When the lag between sensor and device reaches a certain degree, sensor B will use a new data processing method to improve sensor B’s tracking performance.

Tilt Sensor A Hysteresis curve

Tilt sensor B Hysteresis curve

1.73 Steady-state characteristic test
After the device is raised from the horizontal state to 60°, wait for the measurement data output by the inclinometer sensor to stabilize, continue to monitor and collect the sensor output data, and finish the test 5 to 6 hours later. The data generated during the steady state of the sensor is processed. The steady state curve of A is shown in Figure 7, and the steady state curve of B is shown in Figure 8. It can be seen from FIG. 7 that the output measured value of sensor A is relatively stable in the first 1 hour and 30 minutes. After 1 hour and 30 minutes, the measurement value began to shift to a large place, and reached a maximum value at 2 hours and 20 minutes, and then the deviation became smaller. At 4 hours it returns to its initial stable state again. Sensor A has a maximum offset of 0.007° when the temperature changes violently.
It can be seen from FIG. 8 that the output measured value of sensor B is relatively stable in the first 1 hour and 40 minutes. After 1 hour and 40 minutes, the measured value began to shift to a smaller place, and reached a maximum value at 2 hours and 30 minutes, and then the offset value became smaller. At 4 hours it returns to its initial stable state again. When the temperature change of sensor B is relatively drastic, the maximum offset of the measured value is
0.005°. Comparing FIG. 7 and FIG. 8, it can be concluded that under the same temperature change rate, the deviation of inclinometer sensor A is larger than that of inclination sensor B, and the measurement error of inclinometer sensor A is 0.001° larger than that of inclination sensor B. It can be seen that the steady-state characteristic of inclination sensor B is better than that of inclination sensor A.

Tilt Sensor A Steady-state characteristic

Tilt Sensor B Steady-state characteristic

2 Summary
The starting characteristic, dynamic characteristic and steady-state characteristic of the inclinometer sensor are tested. Through comparative analysis of the test data, the starting characteristic and following characteristic of the inclination sensor A are better. The dynamic lag of inclination sensor B is small, and the Angle deviation is small in steady state and drastic temperature changes.
When we choose the inclination sensor suitable for the device’s use environment, such as ER-TS-12200-Modbus and ER-TS-32600-Modbus, we do not know which one to choose, we can conduct stability test and analysis on it according to the above method. According to the test data results to choose a more suitable one.  

ZigBee technology wireless transmission inclinometer sensor


ER-TS-12200-Modbus Features:

1. Dual axis monitoring (single axis optional);
2. Full range accuracy 0.001°, resolution 0.0005°;
3. Volume (94*74*64mm) (customizable).

Datasheet: https://www.ericcointernational.com/tilt-sensor/wireless-transmission-tilt-sensor/high-precision-wireless-transmission-tilt-sensor.html

Introduction
ER-TS-12200-Modbus High Precision Wireless Transmission Tilt Sensor is a wireless inclination sensor with ultra-low power consumption, small size and high performance, which is aimed at the industrial application of users without power supply or real-time dynamic measurement of object attitude angle. Powered by lithium battery, based on Internet of things technology Bluetooth and ZigBee (optional) wireless transmission technology, all internal circuits have been optimized and designed, and various measures such as industrial MCU, three proof PCB board, imported cable, wide temperature metal shell are adopted to improve the industrial level of the product. With good long-term stability and small zero drift, it can automatically enter the low-power sleep mode, so as to get rid of the dependence on the use environment.
The product has compact structure, precise design, recompensation for temperature and linearity, and integrated comprehensive protection functions such as short circuit, instantaneous high voltage, polarity, surge, etc. it is simple and convenient to use. The wireless digital signal transmission method eliminates the cumbersome wiring and noise interference caused by long cable transmission; The industrial design has extremely high measurement accuracy and anti-interference ability. The wireless sensor nodes can form a huge wireless network, support thousands of measuring points to monitor the inclination at the same time, and support professional computer software. Without field survey, it can measure and record the state of the measured object in real time; The safety monitoring system is suitable for remote real-time monitoring and analysis of industrial sites, dilapidated houses, ancient buildings, civil engineering, tilt deformation of various towers and other needs.

Features
Dual axis monitoring (single axis optional)
Range: ±30°
Accuracy: 0.001°, resolution: 0.0005°
Volume (94*74*64mm) (customizable)
Ultra low power consumption
Powered by built-in rechargeable lithium battery
Wide temperature operation -40~+85℃
IP67 protection grade

Applications
Bridge construction
PTZ levelling
Ship navigation attitude measurement
High railway foundation tunnel monitoring
Satellite solar antenna positioning
Medical equipment
Angle control of various construction machinery

Choose a suitable IMU to make your drone flight more stable and safe

         As one of the core components of drones, IMU plays an irreplaceable role. Its high precision, fast response and freedom from extern...