Friday, January 19, 2024

Research on MEMS-IMU signal denoising technology


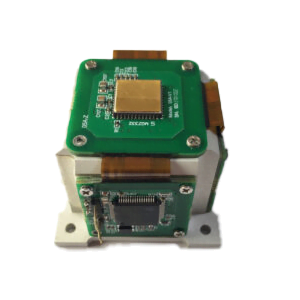
The emergence and rapid development of MEMS (Micro Electro Mechanical System) inertial sensors are promoting the miniaturization of inertial navigation systems. The strategic and tactical value and significance of MEMS inertial technology and micro navigation systems in national defense and military have become prominent.

MIMU is a key unit in inertial systems, and its accuracy determines the performance of the system to a large extent. However, the output signal is usually noisy and non-stationary, and includes influences such as the experimental environment. Therefore, the output signals of the gyroscope and accelerometer obtained from the MIMU unit should be denoised to improve the output accuracy of the MIMU. This article focuses on MEMS-IMU signal denoising technology and uses three different methods: median average method, IIR digital filtering method and wavelet denoising technology to remove noise in the MIMU output signal. Through comparative research on the processing results, the applicability and superiority of wavelet transform in signal denoising processing are confirmed, and the output accuracy of MIMU is improved. This improves the performance of the inertial navigation system.

1.Traditional filtering and denoising method

1.1 Median average filtering denoising

The median average filtering algorithm is one of the simplest signal processing methods. The specific algorithm steps are as follows:

(1) Sort the signals and take the middle value as the median.

(2) Subtract each data point in the signal from the median to obtain the difference.

(3) Average the differences to obtain the average value.

(4) Add the median and average values to obtain the filtering result.

The formula of the median average filtering algorithm is as follows:

The data below is the data of 1000s under static conditions of MEMS-IMU, and the actual sampling frequency is 50Hz. This data is smoothed at 10 sampling points in the experiment. The processing results are shown in the figure below. It can be seen from the figure that the processed signal is relatively smooth.
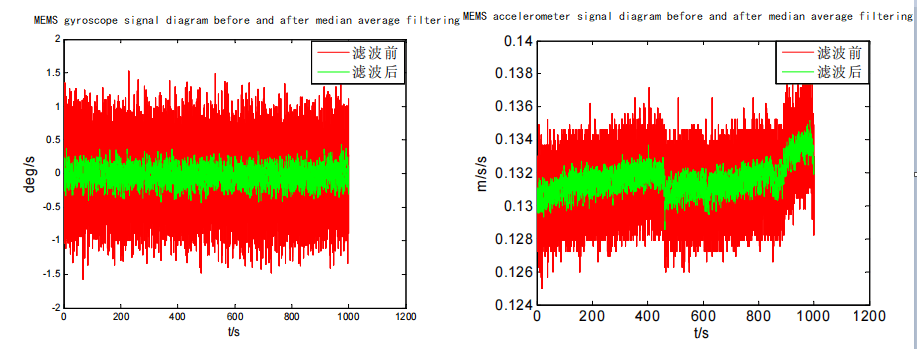
                  Comparison of gyroscope and accelerometer signals before and after median averaging processing

1.2 IIR digital filtering and denoising

Digital filters are divided into IIR (infinite impulse response filter) and FIR (finite impulse response filter). The IIR filter has zero points and can achieve better filtering effects with smaller orders and requires less calculation. Smaller, so IIR filter design is used. Since the frequency band of micromechanical devices is narrow and the Butterworth low-pass filter has the largest flatness characteristics in the low frequency band, the Butterworth low-pass filter is considered.

(1) Spectrum analysis of MIMU output signal

The data below are the output signals of the gyroscope and accelerometer acquired by the navigation computer and subjected to fast Fourier transform.
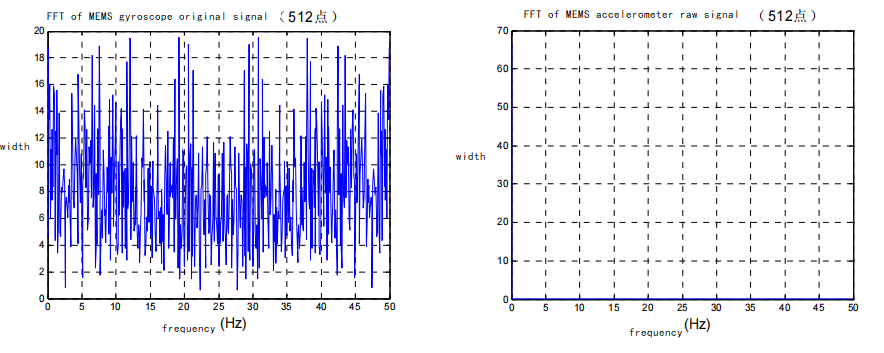
                                                            Gyroscope and accelerometer signal spectrum plots

Observing their spectrum diagrams, as shown in the figure above, it can be seen that the high-frequency interference noise of the gyroscope is very large, almost equal to the amplitude of the useful low-frequency signal;

(2) Digital filter design

Designing an IIR filter generally involves designing an analog filter first, and then converting the analog filter into a digital filter. The square amplitude-frequency characteristic function of the simulated Butterworth filter is:

The transfer function and frequency response of an analog system are related by s=j Ω, so the transfer function Hn (s) of its normalized low-pass filter can be obtained as:
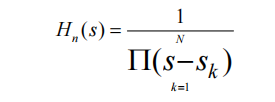
The design steps for an analog filter are:

(1) Given the passband Ω1 and stopband frequency Ω2, the corresponding attenuation coefficients ap and as;

(2) Find the order N of the filter according to the following formula;

Find the cutoff frequency Ωc from the following formula;

Obtain the filter order N and cutoff frequency Ωc according to the above method, so that the transfer function Hn (s) of the analog filter can be obtained, and the analog filter is converted into a digital filter through bilinear mapping. Taking into account the overall requirements, the system requirements Design a digital low-pass filter with technical specifications: fp=10Hz, fs=30Hz, ap=4dB, as=20dB, and a sampling frequency of Fs=50Hz. Substituting into the design formula, the filter order N=5 can be obtained. Use this filter to filter the original signal. The filtered signal spectrum and signal diagram are shown in Figure 3.3. From the figure, it can be seen that the high-frequency noise in the signal is significantly reduced.
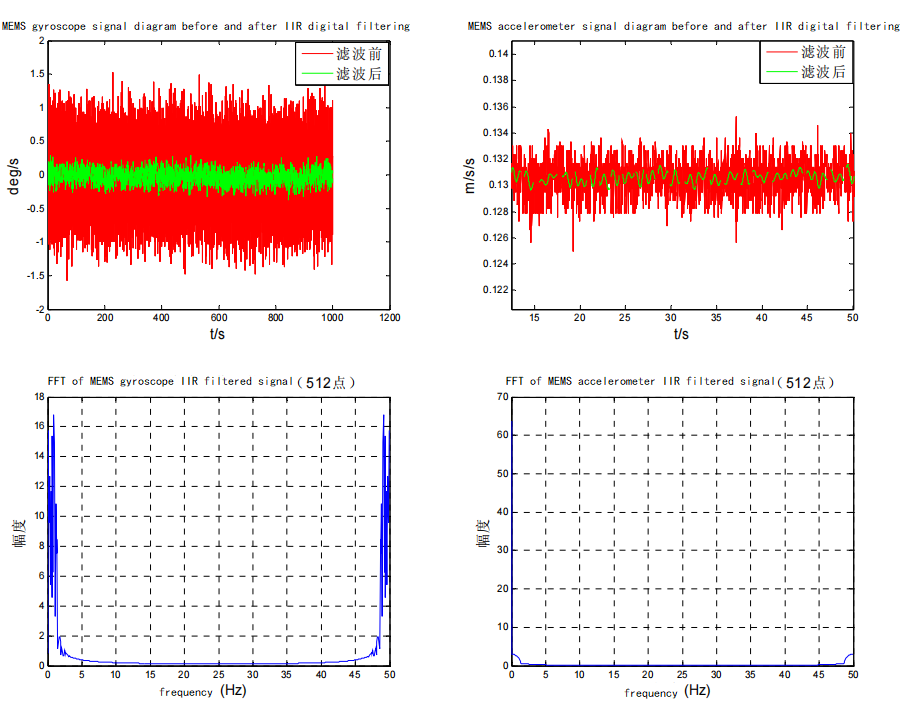
                           Comparison of gyroscope and accelerometer signals before and after IIR digital filtering

2.Wavelet denoising technology

2.1 Principle of wavelet denoising

Wavelet transform theory is a branch of applied mathematics developed in the late 1980s. It is a time-frequency analysis method of signals, which has the characteristics of multi-resolution analysis, and has the ability to characterize the local characteristics of the signal in both time and frequency domains. It is a window with a fixed size but a shape that can be changed. The time window and It is a time-frequency localized analysis method in which the frequency domain window can be changed, so it is known as a signal analysis microscope.

Inspired by the tower algorithm for image decomposition and reconstruction, Mallet proposed a fast algorithm for wavelet decomposition and reconstruction based on the multi-resolution theory, called the Mallet algorithm. This algorithm’s status in wavelet transform is equivalent to FFT in Fourier transform. position in.

(1) Signal decomposition process of Mallet algorithm

The Mallat algorithm, also known as the tower algorithm, uses wavelet filters H0, H1 and G0, G1 to decompose and reconstruct the signal. The decomposition algorithm is as follows:
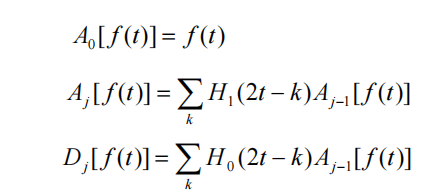
Among them, t is the discrete time sequence number, f(t) is the original signal; j is the number of layers, H0 and H1 are the wavelet decomposition filters in the time domain, and Aj is the approximate part of the signal f(t) in the jth layer. Wavelet coefficient, Dj is the wavelet coefficient of the detailed part of signal f(t) in the jth layer. Assume that the discrete signal f(t) is A0, and the signal f(t) is in the approximate part of the 2jth scale, that is, the wavelet coefficient of the low-frequency part is the wavelet coefficient Aj-1 of the approximate part of the 2j-1th scale and the decomposition filter H1 Convolution, and then sampling the convolution result at intervals, the detailed part of the signal f(t) on the 2j scale, that is, the wavelet coefficient Dj of the high-frequency part is the approximate part of the wavelet coefficient Aj-1 through the 2j-1 scale Convolved with the decomposition filter H0, the convolution result is obtained by sampling at every other point. By decomposition, at each scale 2j, the signal f(t) is decomposed into wavelet coefficients Aj of the approximation part (low-frequency subband) and wavelet coefficients Dj of the detail part (high-frequency subband). The wavelet decomposition algorithm is shown in the figure below.

                                                 Schematic diagram of wavelet decomposition algorithm

(2) Signal reconstruction composition of Mallet algorithm

The reconstruction algorithm is as follows:

In the above formula, G0 and G1 are wavelet reconstruction filters in the time domain. The wavelet coefficient Aj of the low-frequency part is convolved with the reconstruction filter G0 through the wavelet coefficient Aj+1 of the approximation part of the 2j+1 scale after zero interpolation at every other point, and the wavelet coefficient of the detail part of the 2j+1 scale is interpolated with zero at every other point. The reconstruction filter G1 is convolved and then summed. This process is repeated until the 20th scale to obtain the reconstructed signal. The wavelet reconstruction algorithm is shown in the figure below.

                                                         Schematic diagram of wavelet reconstruction algorithm

(3) Small waveform analysis and denoising of signals

The process of using wavelet analysis algorithm to denoise the signal is as follows: first perform wavelet decomposition on the signal, and then process the coefficients after wavelet decomposition in the form of threshold domain values; then perform wavelet reconstruction on the signal, so that elimination can be achieved noise purpose. Generally speaking, as the transformation scale increases, the resolution becomes higher and higher, and the filtering effect becomes better and better. However, in practical applications, factors such as the amount of calculation and rounding error of calculation must be taken into consideration, so the required wavelet transform scale is determined based on the actual accuracy requirements and various influencing factors. In the paper, based on the comparison of the effects of different wavelet bases and different decomposition layers, the 5-level Debauches2 wavelet was selected for the signal.

Summarize

Three different methods: median averaging method, IIR digital filtering method and wavelet transform all have certain effects on removing noise in MIMU output signals. Among them, the median average method is the simplest and has the shortest filtering time, so it is a more commonly used method. However, when the MIMU outputs a high dynamic signal, this method cannot be used, and the IIR digital filtering method or the wavelet denoising method must be used for denoising. The time of digital filtering is relatively short, while the wavelet denoising method requires decomposition and reconstruction of the signal, which takes a longer time, but the accuracy of wavelet denoising is higher than that of digital filtering. Therefore, when we use high-performance hardware, we can implement wavelet transform with fewer decomposition levels for denoising, thereby improving the inertial navigation accuracy to a certain extent. As a company specializing in inertial navigation products, ERICCO focuses on the development and research of high-performance MEMS IMUs and conducts professional signal denoising for navigation-level IMUs and tactical-level IMUs. For example, ER-MIMU-01 and ER-MIMU-05 have less signal noise interference and have many application fields, such as oil exploration, bridges, high-rise buildings, towers, dam monitoring, geotechnical monitoring, mining, etc. , can reduce interference through signal noise denoising. ​

https://www.ericcointernational.com/application/research-on-mems-imu-signal-denoising-technology.html

Temperature Error Analysis of Quartz Accelerometer

 Quartz accelerometer is an important sensitive element in the strapdown inertial navigation system, which is used to detect the linear acceleration of the carrier. As a sensitive linear accelerometer, its internal structure design is not perfect, so many external factors have a great impact on the accuracy of the accelerometer. If the error compensation is not carried out, the error generated in the measurement process will have a great impact on the accuracy of the whole system. Among many environmental factors, the influence of temperature and vibration cannot be ignored, among which, the compensation of temperature error is relatively easy to realize and urgently needs to be solved.

Establishment of quartz accelerometer model

Quartz flexible accelerometer is a pendulum accelerometer in essence, the carrier is in constant motion, its linear motion and angular motion will affect the measurement accuracy of the pendulum accelerometer, is the main source of error. Under the condition of online movement, according to the basic principle of the accelerometer, the output value of the accelerometer and the specific force subjected to the pendulum can be described by mathematical expression, which is called the static mathematical model of the accelerometer, and in the process, the mathematical relationship between the generated measurement error value and the specific force subjected to the pendulum is called the static mathematical model of the accelerometer.

Pendulum components, signal sensors and torquers are the three most important components of pendulum accelerometers. The physical quantity that the accelerometer is sensitive to is the specific force. In order to measure the specific force accurately, a closed-loop system must be installed. The closed-loop system consists of a torque rebalancing loop.

In an ideal state, the steady state output value of the accelerometer (current or Angle) is proportional to the input specific force, that is

Acceleration sensor stable output value

Where m is the mass of the pendulum component, Lp is the distance that the center of mass of the pendulum component deviates from the output axis along the pendulum axis, Kt is the gain of the torque rebalancing loop, and aI is the specific force along the input axis.

Effect of temperature on quartz accelerometer

The output of the accelerometer used is the number of pulses, the output is proportional to the input acceleration, and the static equation can be written as

Accelerometer static equation

According to the static equation, the static accuracy of the accelerometer is mainly determined by the stability of the pendulum KB and the torque factor Kt. Torquer is an important part of the closed-loop feedback system of this kind of accelerometer. The power consumption of the torquer is proportional to the square of the voltage, and according to the formula, the power consumption is also proportional to the square of the input acceleration value, so the temperature change caused by the heating of the torquer itself will cause the instability of the scale factor. The table head is the main source of temperature error. From this we can see that the temperature coefficient of the scale factor of the torquer and the temperature change of the dial head determine the temperature error of the accelerometer.

When the accelerometer enters the stable working state, the temperature change of the meter head mainly comes from external and internal causes, and the external cause is the temperature change of the external working environment. The internal cause is that the torque coil works normally and heats up, and the heat generated indirectly affects the temperature of the meter head. When the quartz flexible accelerometer is in the working environment, from the power into the working state to adapt to the ambient temperature. During this period, the most important head temperature is unstable, and the output value of the quartz flexible accelerometer has a large deviation.

The balance element of the quartz flexible accelerometer is the permanent magnet torque coil, and the temperature change will affect the magnetic field, thus affecting the scale factor. However, temperature changes not only affect the magnetic field, but also the signal sensor, the elastic coefficient and the damping coefficient.

Static error model of quartz accelerometer

Static mathematical model equation of quartz flexible accelerometer

Quartz accelerometer static simulation equation

The further simplified model equation is

simplified quartz accelerometer static simulation equation

E is the output of the accelerometer, and the output unit is volt, milliampere, pulse number per second, etc.

K1is a scale factor, expressed in volts per gravity, milliamps per gravity, pulses per second per gravity;

K0 is the partial value, the unit is the acceleration of gravity;

K2is a second-order nonlinear coefficient;

Ai、aand ao are the accelerations along the IA,PA and OA axes respectively, and the unit is the acceleration of gravity;

δo is the installation error of the input axis relative to the input reference axis IA around the output reference axis OA, in radians;

δp is the installation error of the input axis relative to the input reference axis IA around the output reference axis PA, expressed in radians.

Static temperature experiment and compensation method

The purpose of static temperature test is to measure the Ko and Ki values at different temperatures, and then compensate the error of offset value and scale factor by algorithm.

Test objectives: To determine the offset K0, scale factor K, second-order nonlinear coefficient K2, input shaft installation errors δo and δp of the accelerometer under different temperature conditions.

Test steps:

Step1: Place the quartz accelerometer on the temperature control turntable and connect the experimental equipment and instruments.

Step2: Start the quartz accelerometer and make it work on the temperature control turntable for more than 30 minutes. Set the temperature of the temperature control turntable to T=0℃, wait for the temperature inside the temperature control box to stabilize and hold for more than 30 minutes, and then start the test.

Step3: Rotate the turntable clockwise, make the measurement axis in order at 0°, 90°, 180°, 270° four positions, continue to measure the output value of multiple groups of quartz accelerometers, the test time at each position is 30 minutes.

Step4: Rotate the turntable clockwise to 360°, and then rotate the turntable counterclockwise to make its Angle at 270°, 180°, 90° and 0°, and continuously measure the output values of multiple groups of accelerometers. The test time was 30 minutes at each location.

Step5: Temperature control turntable increase the temperature T=5℃, until the temperature in the temperature control box is stable and held for more than 30 minutes, repeat the third and fourth steps, and record the experimental data.

Summary

The static output of quartz accelerometer has very good repeatability. Under the condition of stable and repeatable output, the temperature error compensation model can be established to improve its accuracy. ERICCO’quartz acceleration sensor series products are represented by ER-QA-01A, which has a bias repeatability of 10μg and a scale factor of 10 ppm. After long-term use, its accuracy can also be improved by temperature compensating. For different quartz acceleration sensor, the scale factor and offset value are unique, and the change amount and change situation are not the same, so the temperature compensation for different accelerometers should be tested and compensated separately.

the full text link:https://www.ericcointernational.com/application/temperature-error-analysis-of-quartz-accelerometer.html

Email : info@ericcointernational.com

Whats app:13992884879

Thursday, January 18, 2024

Research on Angle Control Technology of Tilt Sensor


Why introduce tilt sensors to form a closed-loop control system?

How to calibrate the inclinometer sensor and connect it to the coordinated loading control system becomes the key to solve the following problems.
In the traditional structural strength test, the coordinated loading control system mainly controls the load and displacement. Its core control unit belongs to closed-loop negative feedback regulation, and PID control is commonly used in engineering. However, in the loading process of an aircraft structure strength test, it is required to test the performance characteristics of a moving mechanism while the mechanical load is loaded, but the regulator of the mechanism belongs to open loop control, and it cannot be measured effectively and accurately during the loading process. This requires the introduction of inclinometer sensors in the actual loading process to form a closed-loop control system to achieve accurate Angle control. Therefore. In this paper, the signal parameters of tilt sensor are studied and tested, and the calibration method of sensor feedback signal and the method of signal participating in closed-loop control are proposed to realize real-time Angle measurement and control of the moving mechanism of test piece.

1. The way the inclination sensor is connected to the coordinated loading control system
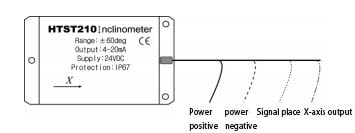
In the strength test of a new type of structure, it is necessary to apply mechanical load while coordinating the loading control system can synchronously monitor the Angle change of the moving mechanism of the test piece, that is, the Angle change between the measuring surface and the horizontal plane. Therefore, the inclination sensor is introduced in the test for the Angle monitoring of the moving mechanism of the test piece. The inclination sensor is shown in Figure 2.

tilt sensor

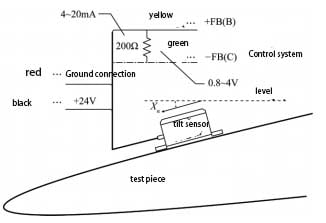
The output signal of the inclination sensor is DC analog signal, which needs external 24V DC excitation power supply in normal operation. The excitation power supply provided by DC voltage regulator power supply is used as the excitation power supply of the inclinometer sensor in the test. After research, there are two ways to connect the output of the inclination sensor to the coordinated loading control system. One is to transform the sensor connection mode of the coordinated loading control system and access it from the sensor channel panel; the other is to use the BNC connector to access it from the analog input channel. We test Angle parameters to participate in closed-loop control, so choose the first access mode. In addition, since the channel input of the control system recognizes the DC voltage signal, the output signal of the inclination sensor needs to be converted before it is connected to the control system. A precise resistor is connected at the output end of the inclination sensor to convert the output signal of the inclination sensor from current signal to voltage signal. The access control system is shown in Figure 2.

tilt sensor-Access control system

2 Calibration method
Since the voltage signal is an analog signal, it is necessary to calibrate the voltage signal after it is connected to the control system, that is, the corresponding relationship between the output voltage value of the inclination sensor and the actual Angle value is determined by adjusting the channel gain, △k, zero point, unit and other parameters, and ensure that the reading result of the control system is consistent with the actual Angle when the actual Angle is changed. There are two ways of calibration, respectively to test it, the process is as follows.

2. 1 Zero gain method
Firstly, a precision resistor with a fixed resistance value of 200Ω is connected at both ends of the output signal line of the inclination sensor, so that the DC current signal output by the inclination sensor becomes the DC voltage signal that the control system can recognize. The signal output range of the inclinometer sensor is: 4 ~ 20 mA, and the corresponding voltage signal range is: 0.8 ~ 4 V. The maximum voltage range allowed by the coordinated loading control system is -10 ~ 10 V. The signal gain of the input channel can be calculated according to the following formula.

tilt sensor zero gain formula

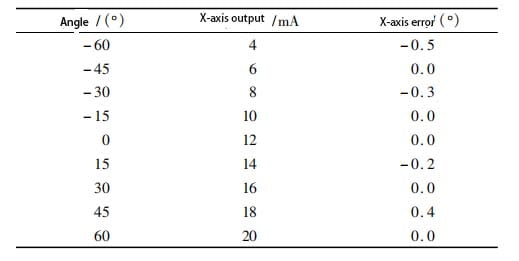
Input this gain into the analog signal channel, and then place the inclination sensor horizontally. Refer to the following table to obtain the current value corresponding to the output of the inclination sensor when it is placed horizontally, and then convert it to the voltage value. Then adjust the zero point to make the voltage displayed by the control system this voltage value.

Single-axis tilt sensor test results

2. 2 Calculate the channel method
The Angle θ of the inclinometer sensor and the X axis output x are linear, that is, θ = k × x + b
Referring to the specific values in the table above, the least square method can be used to determine the linear relationship between the Angle θ(°) and the X-axis output x(mA), that is, to determine the k and b values. As with the gain method, a precision resistor with a fixed resistance value of 200Ω is connected at both ends of the output signal line of the inclinometer sensor, so that the DC current signal output by the inclination sensor becomes the DC voltage signal that the control system can recognize. Finally, the voltage feedback signal V of the inclination sensor monitored by the control channel is assigned to a calculation channel, and the corresponding Angle value can be obtained by editing the voltage feedback signal of the control channel into the following formula through the formula editor module of the calculation channel:

tilt sensor voltage feedback formula

When the unit of the computing channel is set as the Angle, the real-time monitoring of the Angle can be realized through the computing channel. The zero gain method and the calculation channel method are used to calibrate the two inclination sensors respectively, and the results are consistent with the actual Angle, which proves that the two calibration methods are feasible.
3. Test and verification
In the strength test of a new type structure, the deflection Angle of the moving airfoil is measured and controlled by introducing an inclination sensor.
3. 1 Test system construction
The inclination sensor is attached to the active airfoil, and the output axis X axis is perpendicular to the deflection direction of the active airfoil, which is used to measure the deflection Angle of the active airfoil relative to the horizontal plane. The measurement signal is connected to the coordinated loading control system through either of the above two access methods. The inclinometer sensor is pasted as shown in Figure 2.
The Angle deflection of the movable airfoil is driven by the rotation of the steering wheel and the deflection of the movable airfoil through the hydraulic swing cylinder installed in the cockpit. The hydraulic swinging cylinder is fixed to the driving disc, and a torque sensor is installed between the two to monitor the torque during the rotation of the driving disc driven by the swinging cylinder; The rear end of the hydraulic swing cylinder is connected with an angular displacement sensor to measure the rotation Angle of the steering wheel in real time. The signals of the torque sensor and the angular displacement sensor are simultaneously connected to the coordinated loading control system for monitoring or control, and the output control signal of the control system controls the opening size of the servo valve to achieve accurate control of the deflection Angle of the movable airfoil.
Should note:
① The angular displacement sensor and the hydraulic swing cylinder are fixed connected, and the rotating shaft has no relative rotation;
② The rotation axis of the angular displacement sensor, hydraulic swing cylinder and torque sensor should be in the same straight line and remain level on the horizontal plane.
3. 2 Test Method
Coordinated loading control system, hydraulic swing cylinder and angular displacement sensor constitute closed-loop control. The command given by the control system is the rotation Angle command of the steering wheel, and the control cylinder drives the steering wheel to rotate, so as to realize the Angle deflection of the movable airfoil; The inclinometer sensor only acts as the Angle measurement and monitoring of the active airfoil, and calculates and monitors the Angle of the active airfoil in real time through the computing channel.
3. 3 Test results and analysis
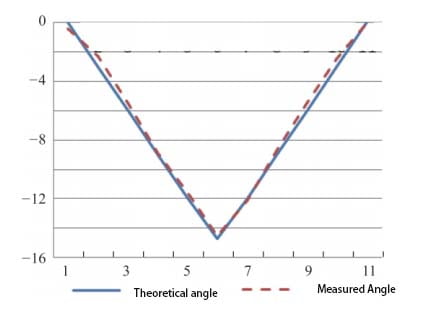
The test adopts method one to control loading, the results show that the Angle control can be realized, and the control accuracy meets the requirements of the test. The angular deflection results of the movable airfoil are shown in Figure 3.

tilt senor-The result of the angular deflection of the movable airfoil

4 Summary
The technique has been successfully verified in the control test of a certain type of aircraft elevator (rudder surface with load). Ericco’s ER-TS-3160VO and ER-TS-4158CU are two hot-selling tilt sensors of voltage and current type. They can access the control system from the sensor channel panel by modifying the sensor wiring mode of the coordinated loading control system. Because the input end of the control system’s channel recognizes DC voltage signals, Therefore, before the sensor output signal is connected to the control system, the output signal needs to be converted. A precise resistor is connected at the output end to convert the output signal from current signal to voltage signal. By using the test system, the deflection degree of the moving airfoil is controlled while the mechanical load is applied to the moving airfoil. The test system can be further improved and optimized, so that the control quality is higher and the application range is wider. 

Research on MEMS-IMU signal denoising technology


The emergence and rapid development of MEMS (Micro Electro Mechanical System) inertial sensors are promoting the miniaturization of inertial navigation systems. The strategic and tactical value and significance of MEMS inertial technology and micro navigation systems in national defense and military have become prominent.

MIMU is a key unit in inertial systems, and its accuracy determines the performance of the system to a large extent. However, the output signal is usually noisy and non-stationary, and includes influences such as the experimental environment. Therefore, the output signals of the gyroscope and accelerometer obtained from the MIMU unit should be denoised to improve the output accuracy of the MIMU. This article focuses on MEMS-IMU signal denoising technology and uses three different methods: median average method, IIR digital filtering method and wavelet denoising technology to remove noise in the MIMU output signal. Through comparative research on the processing results, the applicability and superiority of wavelet transform in signal denoising processing are confirmed, and the output accuracy of MIMU is improved. This improves the performance of the inertial navigation system.

1.Traditional filtering and denoising method

1.1 Median average filtering denoising

The median average filtering algorithm is one of the simplest signal processing methods. The specific algorithm steps are as follows:

(1) Sort the signals and take the middle value as the median.

(2) Subtract each data point in the signal from the median to obtain the difference.

(3) Average the differences to obtain the average value.

(4) Add the median and average values to obtain the filtering result.

The formula of the median average filtering algorithm is as follows:

The data below is the data of 1000s under static conditions of MEMS-IMU, and the actual sampling frequency is 50Hz. This data is smoothed at 10 sampling points in the experiment. The processing results are shown in the figure below. It can be seen from the figure that the processed signal is relatively smooth.

                  Comparison of gyroscope and accelerometer signals before and after median averaging processing

1.2 IIR digital filtering and denoising

Digital filters are divided into IIR (infinite impulse response filter) and FIR (finite impulse response filter). The IIR filter has zero points and can achieve better filtering effects with smaller orders and requires less calculation. Smaller, so IIR filter design is used. Since the frequency band of micromechanical devices is narrow and the Butterworth low-pass filter has the largest flatness characteristics in the low frequency band, the Butterworth low-pass filter is considered.

(1) Spectrum analysis of MIMU output signal

The data below are the output signals of the gyroscope and accelerometer acquired by the navigation computer and subjected to fast Fourier transform.

                                                            Gyroscope and accelerometer signal spectrum plots

Observing their spectrum diagrams, as shown in the figure above, it can be seen that the high-frequency interference noise of the gyroscope is very large, almost equal to the amplitude of the useful low-frequency signal;

(2) Digital filter design

Designing an IIR filter generally involves designing an analog filter first, and then converting the analog filter into a digital filter. The square amplitude-frequency characteristic function of the simulated Butterworth filter is:

The transfer function and frequency response of an analog system are related by s=j Ω, so the transfer function Hn (s) of its normalized low-pass filter can be obtained as:

The design steps for an analog filter are:

(1) Given the passband Ω1 and stopband frequency Ω2, the corresponding attenuation coefficients ap and as;

(2) Find the order N of the filter according to the following formula;

Find the cutoff frequency Ωc from the following formula;

Obtain the filter order N and cutoff frequency Ωc according to the above method, so that the transfer function Hn (s) of the analog filter can be obtained, and the analog filter is converted into a digital filter through bilinear mapping. Taking into account the overall requirements, the system requirements Design a digital low-pass filter with technical specifications: fp=10Hz, fs=30Hz, ap=4dB, as=20dB, and a sampling frequency of Fs=50Hz. Substituting into the design formula, the filter order N=5 can be obtained. Use this filter to filter the original signal. The filtered signal spectrum and signal diagram are shown in Figure 3.3. From the figure, it can be seen that the high-frequency noise in the signal is significantly reduced.

                           Comparison of gyroscope and accelerometer signals before and after IIR digital filtering

2.Wavelet denoising technology

2.1 Principle of wavelet denoising

Wavelet transform theory is a branch of applied mathematics developed in the late 1980s. It is a time-frequency analysis method of signals, which has the characteristics of multi-resolution analysis, and has the ability to characterize the local characteristics of the signal in both time and frequency domains. It is a window with a fixed size but a shape that can be changed. The time window and It is a time-frequency localized analysis method in which the frequency domain window can be changed, so it is known as a signal analysis microscope.

Inspired by the tower algorithm for image decomposition and reconstruction, Mallet proposed a fast algorithm for wavelet decomposition and reconstruction based on the multi-resolution theory, called the Mallet algorithm. This algorithm’s status in wavelet transform is equivalent to FFT in Fourier transform. position in.

(1) Signal decomposition process of Mallet algorithm

The Mallat algorithm, also known as the tower algorithm, uses wavelet filters H0, H1 and G0, G1 to decompose and reconstruct the signal. The decomposition algorithm is as follows:

Among them, t is the discrete time sequence number, f(t) is the original signal; j is the number of layers, H0 and H1 are the wavelet decomposition filters in the time domain, and Aj is the approximate part of the signal f(t) in the jth layer. Wavelet coefficient, Dj is the wavelet coefficient of the detailed part of signal f(t) in the jth layer. Assume that the discrete signal f(t) is A0, and the signal f(t) is in the approximate part of the 2jth scale, that is, the wavelet coefficient of the low-frequency part is the wavelet coefficient Aj-1 of the approximate part of the 2j-1th scale and the decomposition filter H1 Convolution, and then sampling the convolution result at intervals, the detailed part of the signal f(t) on the 2j scale, that is, the wavelet coefficient Dj of the high-frequency part is the approximate part of the wavelet coefficient Aj-1 through the 2j-1 scale Convolved with the decomposition filter H0, the convolution result is obtained by sampling at every other point. By decomposition, at each scale 2j, the signal f(t) is decomposed into wavelet coefficients Aj of the approximation part (low-frequency subband) and wavelet coefficients Dj of the detail part (high-frequency subband). The wavelet decomposition algorithm is shown in the figure below.

                                                 Schematic diagram of wavelet decomposition algorithm

(2) Signal reconstruction composition of Mallet algorithm

The reconstruction algorithm is as follows:

In the above formula, G0 and G1 are wavelet reconstruction filters in the time domain. The wavelet coefficient Aj of the low-frequency part is convolved with the reconstruction filter G0 through the wavelet coefficient Aj+1 of the approximation part of the 2j+1 scale after zero interpolation at every other point, and the wavelet coefficient of the detail part of the 2j+1 scale is interpolated with zero at every other point. The reconstruction filter G1 is convolved and then summed. This process is repeated until the 20th scale to obtain the reconstructed signal. The wavelet reconstruction algorithm is shown in the figure below.

                                                         Schematic diagram of wavelet reconstruction algorithm

(3) Small waveform analysis and denoising of signals

The process of using wavelet analysis algorithm to denoise the signal is as follows: first perform wavelet decomposition on the signal, and then process the coefficients after wavelet decomposition in the form of threshold domain values; then perform wavelet reconstruction on the signal, so that elimination can be achieved noise purpose. Generally speaking, as the transformation scale increases, the resolution becomes higher and higher, and the filtering effect becomes better and better. However, in practical applications, factors such as the amount of calculation and rounding error of calculation must be taken into consideration, so the required wavelet transform scale is determined based on the actual accuracy requirements and various influencing factors. In the paper, based on the comparison of the effects of different wavelet bases and different decomposition layers, the 5-level Debauches2 wavelet was selected for the signal.

Summarize

Three different methods: median averaging method, IIR digital filtering method and wavelet transform all have certain effects on removing noise in MIMU output signals. Among them, the median average method is the simplest and has the shortest filtering time, so it is a more commonly used method. However, when the MIMU outputs a high dynamic signal, this method cannot be used, and the IIR digital filtering method or the wavelet denoising method must be used for denoising. The time of digital filtering is relatively short, while the wavelet denoising method requires decomposition and reconstruction of the signal, which takes a longer time, but the accuracy of wavelet denoising is higher than that of digital filtering. Therefore, when we use high-performance hardware, we can implement wavelet transform with fewer decomposition levels for denoising, thereby improving the inertial navigation accuracy to a certain extent. As a company specializing in inertial navigation products, ERICCO focuses on the development and research of high-performance MEMS IMUs and conducts professional signal denoising for navigation-level IMUs and tactical-level IMUs. For example, ER-MIMU-01 and ER-MIMU-05 have less signal noise interference and have many application fields, such as oil exploration, bridges, high-rise buildings, towers, dam monitoring, geotechnical monitoring, mining, etc. , can reduce interference through signal noise denoising. ​


https://www.ericcointernational.com/application/research-on-mems-imu-signal-denoising-technology.html

High-precision IMU is coming to help in the fields of land, sea and air

  High-precision IMU is now widely used in many fields of sea, land and air. It can provide real-time and accurate information on the carrie...