Thursday, March 28, 2024

Large Outdoor Advertising Monitoring Based on Tilt Sensor

 When it comes to the use of tilt sensors to monitor angles, people's first reaction may feel very strange, in fact, we often use the mobile phone has a similar function, it is easy to search the relevant app in the mobile app store, and it is also very convenient to use, although there may be no one in the work really use the mobile phone as a measurement tool. But we can fully see that the measurement of the tilt Angle has been very easy.

At present, the inclination sensors used in many fields are basically based on MEMS (Micro-electro Mechanical System for short, Chinese name micro-electro-mechanical system) tilt sensors, around 1960, the United States took the lead in studying MEMS technology, Then France, Germany, Switzerland, Japan and other countries also began to pay attention to MEMS research work, China's MEMS research began in 1989, to 1999, China's domestic MEMS research and development units have reached more than 50, the level of scientific research can also be placed in the international top ten. As of 2010, there are about 600 units engaged in the research and production of MEMS in the world.
MEMS is an independent intelligent system, which integrates micro sensor, signal processing, actuator, interface circuit, control circuit, communication and power supply in one. It has the advantages of small size, low power consumption, light weight, strong durability, high stability, low price and easy mass production. It can be seen that MEMS refers to a system that is integrated by multiple devices. The current research on MEMS technology mainly includes: micro-mechanical pressure sensor, micro-gas sensor, micro-acceleration sensor, micro-flow sensor, micro-mechanical gyroscope, micro-mechanical temperature sensor and other micro-mechanical sensors.
Mems-based sensors have many uses, measuring tilt angle is just one of them, using acceleration sensors, such as gas flow measurement, temperature measurement, pressure measurement, and so on.
The application of MEMS technology to monitor the tilt angle of large outdoor advertisements is not a blind decision.

1. Monitoring methods for large-scale outdoor advertising
At present, there are four main monitoring methods for large-scale outdoor advertising:

(1) Camera monitoring
Due to the large outdoor advertising area is large, very eye-catching, mostly erected in bustling areas, highways and overpasses near, these geographical locations are also key jurisdiction areas of the city, therefore, these areas are basically covered by urban surveillance cameras, administrators can view large advertising and its surrounding situation through real-time monitoring. Although this monitoring method seems to have the characteristics of real-time, but it is difficult to achieve in practical applications, the monitor can not always stare at the surveillance video, and when the visibility is low, the effect of the surveillance video will be reduced a lot, affecting the observation of the monitor, therefore, the use of this method to monitor large-scale advertising is not ideal.

(2) Regular manual inspection
Surveyors field measurement is the most traditional monitoring method, the longest application time, the monitoring process is relatively mature,
This method is mainly used by inspectors to measure large advertisements using steel tape, optical theodolite, portable ultrasonic flaw detector, weld gauge, rebound meter and other equipment. Due to the support of high-precision data, this method has high credibility, but in order to achieve rapid and comprehensive monitoring of all large advertisements, not only need multiple sets of monitoring equipment. It also needs to use more manpower and material resources, which is very inconvenient, and this method is mainly preventive, which cannot achieve real-time understanding of large-scale advertising conditions, so this method is not ideal.

(3) Monitoring based on radio frequency technology
The technology is a non-contact automatic identification technology that emerged around 1990, which carries out non-contact two-way data transmission between the base station and the radio frequency card to achieve the purpose of identifying the target and data transmission. This method mainly uses 2.4GHz active radio frequency electronic tag to record the attribute information and location information of large advertisements. The electronic tag can sense the displacement, and a receiving base station is required to receive, process and transmit the data sent by the electronic tag. The technology is widely used in many fields such as small advertising management, highway ETC express lanes, logistics, retail and so on.
Although this method can obtain the position data of large advertisements in real time, it is not its strong point in monitoring the tilt Angle. This method can make up for the shortcomings of the above two methods, but the final result can not measure the tilt of large advertisements

(4) Sensor-based inclination monitoring
Tilt sensor is often used to measure the change in inclination relative to the horizontal plane, it is based on Newton's second law as a theory, according to the basic principles of physics, in a system, the speed can not be measured, but can measure its acceleration, under the condition of the initial speed is known, you can use the integral method to calculate the line speed, and then calculate the linear displacement. So it's an acceleration sensor that uses the principle of inertia. The tilt sensor is fixed on the back of a large advertisement, and the single chip microcomputer is used as the central controller to integrate the monitored angle data, monitoring time, monitoring site number and other information, and then through the General Packet Radio Service (GPRS), The wireless communication module will send out the packaged data, and the data will be analyzed and processed by the monitoring personnel, and this equipment is powered by solar energy + battery, making the equipment more independent and easier to manage. This method can understand the angle information of large advertisements in real time. In the case of investing very little manpower and material resources, you can fully understand the situation of each large advertisement, and the data credibility is high, so this way is more ideal.

2 Summary
In summary, after a more detailed analysis of various monitoring methods, it is not difficult to see that the method based on tilt sensors is the best to use this method to monitor the tilt of large-scale outdoor advertising. Ericco has various precision and types of tilt sensors, like ER-TS-3160VOER-TS-12200-Modbus, widely used in Bridges, DAMS, building monitoring and other fields, if you want to buy or want more technical data of tilt sensor, you can contact us at any time.
Tuesday, March 26, 2024

FOG Inertial Measurement Unit Data Acquisition System

 According to the application background of a project, a strapdown inertial measurement unit (FOG Inertial Measurement Unit) is designed and implemented with open-loop fiber optic gyro and silicon micro-accelerometer as inertial sensing components and high-speed DSP as signal processor. The system implements the basic function of sending out angular velocity information and specific force information every 10 ms. Considering the operating characteristics of the system, corresponding measures are taken in the design of software and hardware of the system to ensure the accuracy of the system, improve the real-time performance of the system, and expand the system function. Finally, the system is tested, and the results show that the system has reached the expected design goal.

The inertial navigation system can measure the carrier's heading, attitude and position in real time. Compared with the platform inertial navigation system, the strapdown inertial navigation system replaces the electromechanical physical platform with the "mathematical platform" stored in the computer. The measurement data of the gyroscope and accelerometer are collected by the computer, and the information such as the position, attitude and heading of the carrier is obtained through solving, which is used for the control and navigation of the carrier.

Compared with the traditional flexible gyro, the optical fiber gyro has the advantages of anti-impact and anti-acceleration, short start-up time, high sensitivity and resolution, wide dynamic range, low price, etc., which is suitable for the use in harsh environment, because it is more suitable for the construction of strapdown inertial measurement unit.
Fiber optic gyro strapdown inertial navigation system has become one of the most important development directions in many fields such as aerospace, aviation, maritime and land navigation. At present, fiber optic gyroscopes have obvious advantages in the application range of medium and low precision (0.01 ~ 30 ° / h). Mems-based silicon micro-accelerometers have also been able to achieve 10-3 g or even higher accuracy, and the volume is very small, easy to integrate the system. The strapdown inertial measurement unit using fiber optic gyroscope(FOG Inertial Measurement Unit) and silicon microaccelerometer has the advantages of low cost and small size, and has broad application prospects in both military and civil fields.

1 Overall design of the system
According to the overall requirements of the system, the inertial device selection and system structure design are carried out. Through the error transfer equation of strapdown inertial navigation system, the error analysis and computer simulation results show that the open-loop fiber optic gyro and silicon micro-accelerometer with low precision can meet the requirements of the system index.
The system consists of mechanical structure, three fiber optic gyroscopes, accelerometer components and processing circuit. In the structural design, the sensitive axes of the tourmala components are mutually orthogonal; The accelerometer component composed of 3 circuit boards ensures that the 3 sensitive axes are vertically intersected with the space point during PCB design; The non-orthogonal error of the system can be compensated by software through calibration.

2 Data acquisition module
The data acquisition module mainly completes the functions of sampling, analog filtering, amplifying and modulo conversion of the output signals of 3 doloris and 3 accelerometers. In order to improve the acquisition accuracy of the inertial measurement unit, the pre-processing circuit of the inertial device is designed. The gyro and accelerometer outputs are converted into single-ended and unipolar voltages by two-stage op amp and analog filter, and then A /D conversion is performed. The module collects 8 analog signals, in addition to 3 gyro signals and 3 accelerometer signals, accelerometer chip temperature and ambient temperature are also collected for temperature compensation.

FOG Inertial Measurement Unit Data Acquisition System A D convert

3 Summary
In this paper, the open loop optical fiber toralon and silicon micro-accelerometer are used as inertial devices to design and implement the inertial measurement unit which is applied to the medium and low precision and short time operating system. It can be seen that the data acquisition system has reached the performance index specified in the medium-precision strapdown inertial navigation system. At present, the system has been used in some prototypes of strapdown inertial navigation system and runs well. Ericco has several cost-effective, low-cost FOG inertial measurement units ER-FIMU-50ER-FIMU-60ER-FIMU-70, if you want to get more technical data of FOG inertial measurement units, please feel free to contact us. 

The Working Principle and Method of North Finding of Gyro Theodolite

https://www.ericcointernational.com/application/the-working-principle-and-method-of-north-finding-of-gyro-theodolite.html

Definition

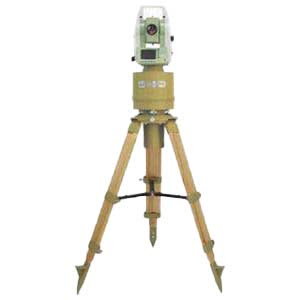
Gyro theodolite is a directional positioning instrument, which is composed of two parts: gyroscope and theodolite. This instrument is a theodolite with a gyroscopic device used to determine the true north azimuth of the line. It uses the precession and fixed axis of the gyroscope itself, sensitive to earth rotation, and can quickly and accurately give the true north position of the measured point anywhere within 75° north and south latitude, so as to determine the true north azimuth of any target.

Gyro theodolite is used to measure the true azimuth simply and quickly, and is not limited by time. It is often used to measure roads, railways, tunnels and mines. The above content is for reference only, if you need detailed information and data of gyrotheodolite, it is recommended to consult relevant professional books or consult experts in the field of surveying and mapping.

1.North seeking working principle of Gyro Theodolite

1.1 Earth’s rotation and gyroscopic precession

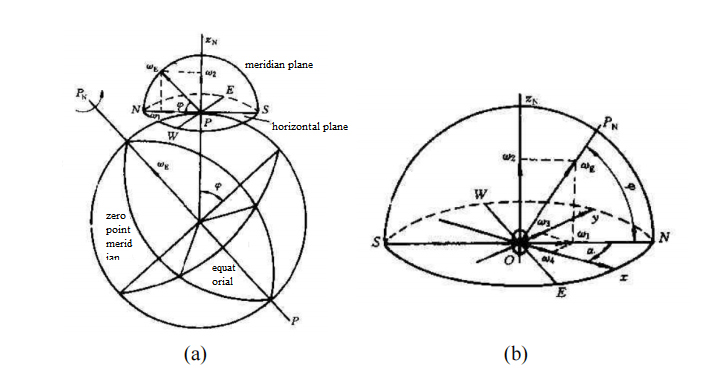
The earth is a constantly rotating object. It rotates around the earth's axis with ωE; therefore, all objects on the earth also rotate at the same time. When you look down at the Earth from above the North Pole, you can find that the Earth's rotation is counterclockwise, and the angular velocity vector ωE points toward the North Pole along the Earth's rotation axis. Assume that the ground point P is at a position with a latitude of ϕ, and the angle between the direction of the earth's rotation angular velocity vector and the horizontal plane at this point is ϕ. At the ground point P, the ωE vector can generally be decomposed into a horizontal component vector ω1 (along the ground The tangent direction of the meridian where the point is located) and the vertical component vector ω2 (along the vertical direction of the meridian where the ground point is located).

Figure 1(b) shows the position of the auxiliary celestial sphere above the ground. Assuming that the center of the earth is O, the earth can be regarded as a point for various celestial bodies other than the earth. If the gyroscope and the observer are both at point O, and the x-axis of the instrument is in the horizontal direction, east of the true meridian, the angle between the two is α. which level

The formula for calculating the components is


Figure 1 Schematic diagram about angular velocity of earth rotation

The rotational component ω2 is the speed at which the gyro rotates around the Z-axis at its ground position. The most direct experience is that the northern end of the meridian moves toward the west. It can be called the vertical component of the rotation of the Earth's sphere. What an observer on the earth experiences is the relative relationship between the heights of other planetary bodies and the sun in inertial space. Therefore, the calculation formula for the vertical component of angular velocity is as follows

In order to specifically express the motion of the gyroscope due to the rotation of the earth, the horizontal rotation component ω1 is further decomposed into factors ω4 (along the x-axis direction) and ω3 (along the y-axis direction), where

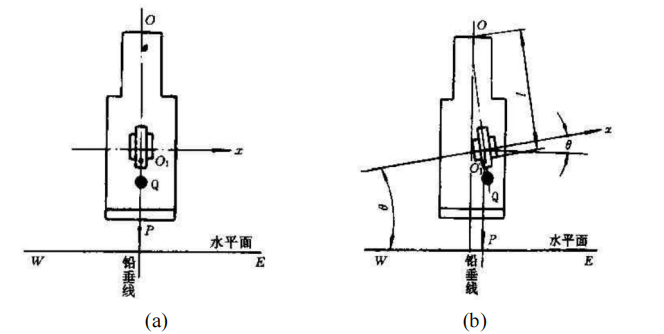
Considering that when the earth rotates as a whole, the gravitational moment on the instrument will push the gyro's polar axis to move along the x-axis, generating a force that returns to the meridian plane where the gyro is located; when the polar axis moves to the ground plane due to the force of the hanging weight (as shown in Figure 1(a) )), does not produce a hanging weight moment, so it has no effect on the change in the orientation of the x-axis [24]. However, since the earth is in a state of constant rotation, the gyroscope main axis and the ground plane are not parallel to each other at the next moment. Intuitively speaking, the positive direction of the x-axis of the gyroscope main axis is raised again relative to the ground, and the angle between it and the ground is different. θ (see Figure 1(b)). Therefore, the moment effect caused by the hanging weight will push the main axis of the instrument to precess in the direction of the meridian plane. Assume that the gravity of the sensitive part of the rotor is P and the center of the rotor is located at position O1. Let the distance between the center of gravity and point O be l. Therefore, considering the rotation of the ground plane around the y-axis, the final rotational moment is:


The precession angular velocity of the x-axis of the instrument spindle is


Therefore, the main axis of the instrument always precesses toward the meridian under the action of the effective factor component ω3 of the earth.

Figure2 Relationship between axis of gyroscope and heavy torque

2.Orientation method of Gyro Theodolite 

The orientation process of the Gyro Theodolite can be divided into coarse north-seeking orientation and fine north-seeking orientation. In coarse north seeking orientation, gyro orientation generally uses the two reversal point method, the three-point timing method, the quarter period method, etc. The most commonly used methods for precise north orientation include the four-point method, the Midheaven method, the integral method, the Shula average method, the Thomas average method, etc.

2.1 Reversal point method

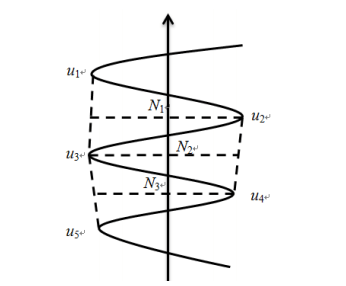
The reversal point method is a gyro orientation measurement method in which the aiming part of the gyro is at the tracking target. It is generally used on rack-mounted suspended Gyro Theodolites. In the process orientation using the reversal point method, we are required to always keep the sighting part in a tracking state, observe and record multiple sets of swing endpoint values, and use this method to calculate the gyro north-seeking direction value. The reversal point method gyro orientation As shown in Figure 3.

Figure3  Method of Observation with Reversal Point

2.2 Zhongtian method

When using the mid-heaven method for gyro directional observation, since the sighting part of the gyro theodolite is in a fixed state at this time, this is a twisted observation. This method requires that when we initially place the gyro, the north direction of the gyro must be approximately within 15′ of true north. When using the mid-heaven method for gyro orientation, generally first fix the sighting part on the gyro theodolite at an approximate north direction N', and record the value of the approximate north direction. Zhongtian method gyro orientation requires that during the entire orientation process, the upper sighting part of the instrument must have a fixed direction and not change.

When using the Midheaven method for observation, the observation time is required to be at least one cycle, and at the same time, the Midheaven time of the Midheaven method can be read through cooperation; usually five Midheaven values can be used for observation and recording, and the untracked swing period also needs to be obtained.

2.3 Integration method

The principle of integral orientation is the same as that of mid-heaven orientation. It also needs to be initially placed in the basic north direction to proceed to the next step. However, the different characteristics of the two methods of orientation are: the Zhongtian method collects multiple point values in the gyro swing for calculation, and has discrete characteristics. The principle of the integration method is to read and capture a large amount of complete data of the gyro's precession swing when the gyroscope precesses, and comprehensively consider the information of each sampling point, so the final north-finding effect is also the best.

2.4 Thomas average method

The Thomas average method is a north-finding algorithm used by gyroscopes when accurately seeking north. The gyro average method collects the values of more than 7 reversal points of the gyro swing stability value, and finally calculates the value of the gyro's north direction through formula calculation. Since the data collected by this method is relatively comprehensive and complete, this method is widely used in the gyro. The total station's accuracy in finding north also works well.

2.5 Damping method

The damping method north-seeking orientation is a north-seeking method that uses the reverse torsional moment when the gyroscope swings, ultimately causing the sensitive part of the gyro to swing rapidly and converge to the true north direction; during this process, the sighting part needs to track the sensitive part at all times. The swing finally converges with the north direction together with the sensitive part. There are many types of damping torsion torque, generally such as electromagnetic torque, suspension torsion torque, etc. The general principle of damping torque is: when the gyro swings to the reversal point, the personnel performs precise tracking and observation of the reversal point through the horizontal micro-motion spiral of the total station, lasting 5-7 times, until the swing amplitude gradually decreases, and finally stabilizes in the north direction. .

Summarize

This chapter mainly introduces the definition of the Gyro Theodolite and the working principle of north seeking, explains in detail the north seeking orientation process of the Gyro Theodolite, and analyzes the orientation principles and accuracy of several orientation methods of the Gyro Theodolite. If you want to learn about or buy a Gyro Theodolite, ERICCO's Gyro Theodolite, such as ER-GT-02, can achieve ultra-high-precision north seeking. Its measurement principle is the integration method, which has strong anti-interference ability and stability. High characteristics. The gyro-theodolite adopts an integrated body design (built-in battery), with compact structure and stable performance. It has functions such as low-level locking, automatic zero-position observation, automatic north seeking, automatic limit, and wide temperature compensation. It is gradually iterating the limiter to provide the north seeking accuracy of the reference plane azimuth angle and reduce the north seeking time.

Welcome to consult and purchase.

Monday, March 25, 2024

Fiber Optic Gyro Track Accuracy Detection

 1. Principle of fiber optic gyroscope instrument inspection vehicle

1.1 Working principle of fiber optic gyroscope
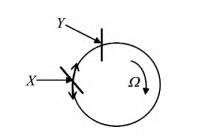
It is assumed that two beams of light with the same characteristics are formed from the same light source in a closed optical path and propagate in opposite directions, and the angular speed of the optical fiber coil rotation in space is calculated by the optical path difference generated by the two beams at the convergence point, that is, the Sagnac effect.
The following diagram shows the Sagnac effect. X is the incident point of the beam, Y is the exit point of the beam, and Ω is the angular rate.

sagnac

1.2 Principle of chord measurement
The detection technology of track irregularity based on fiber optic gyroscope (FOG) is an advanced track detection method in the current string measurement method. Using the gyroscope to measure the Angle, the transfer equation between the track direction is changed by the Angle of the track detector, and the track direction irregularity data is obtained.
2. Analysis of measurement results
2.1 Test scheme
The school has a good surrounding environment, stable geological conditions and good visibility conditions, which provides a favorable external environment for the implementation of the program. The converted length of the track is about 1040m. Among them, about 110m of ballastless track can be used for the detection of the track inspection system.
Fiber optic gyroscope is the main sensor for measuring track irregularity with track inspection car, and its working characteristics are related to the accuracy of track inspection equipment. The test content of track smoothness mainly includes gauge, high height, high height, level, track direction and so on.
We mainly introduce the gauge, level and track direction.
The distance between the 16 mm position under the inner side rail surface of the two rail heads is called the gauge. The difference between the top height of the two rails is called the level. Through repeated measurement of the track level, gauge and track direction of the detection field, the relative internal and external coincidence measurement accuracy of the track detector based on fiber optic gyroscope is verified. The stability of the measuring system, that is, the difference of the measurement results when the track detector repeatedly measures the geometric state parameters of the same section of track. External coincidence accuracy indicates the accuracy of the track inspection equipment, that is, the difference between the measured results and the reference value of the track geometric state parameters should be small enough. The measurement accuracy of internal coincidence is relative difference, and the measurement accuracy of external coincidence is absolute difference.
We use the level 0 digital display track ruler to measure the gauge and level at each mark of the track in the detection field for three times, and the average value is taken as the reference value of the gauge and level, and the average value of the track direction of the 3 times manual pulling string is taken as the reference value of the track direction. After the measurement is completed, the measured data are numbered according to the mark number, and then the measurement difference of gauge, water level, rail forward and forward push at each mark of the detection field track, the repeated measurement difference and the difference between each measurement value and the reference value are calculated, and the measurement accuracy is calculated.
2.2 Test results
The track detector distributed by the public works workshop is divided into two categories according to its different measurement data, one is relative track information detection, and the other is absolute track information detection. The two detection methods are respectively suitable for detection without track control network and detection with track control network. Both types of devices are hand-pushed, with absolute detection speed of 200m/h and relative detection speed of 4km/h. The median error of the difference meets the requirement of the difference limit, indicating that the accuracy of the track detector meets the requirement.
The mean error of the difference between the gauge measurement value and its reference value is slightly higher than the mean error limit, but within 3%, which basically meets the requirements. This result may be caused by the condition of the track detection field or human factors caused by the 0 level digital gauge measured by the gauge reference value measurement accuracy exceeds the limit. Based on this, it is considered that the accuracy of the track detector meets the requirements.

3 Summary
We use fiber optic gyroscope to measure the Angle, and change the transfer equation between the track direction by the Angle of the track detector, so as to obtain the track direction irregularity data. Ericco has high performance, low cost fiber optic gyro, like ER-FOG-851ER-FOG-910, pure solid state fiber optic gyro, long life, if you want to get more technical data, please feel free to contact us. 

Tuesday, March 5, 2024

Soft Magnetic Error Compensation Method of Electronic Compass


1. Analysis of soft magnetic error of electronic compass

There is another ferromagnetic substance in the working environment of the electronic compass sensor, which, unlike hard ferromagnetic materials, is easily magnetized in a weak magnetic field. When the external magnetic field changes, its induced magnetism will also undergo a related change. The size and direction of the induced magnetic field will also change with the attitude and position of the carrier.
Because of its special properties, this material is called soft iron material. This soft iron material magnetizes itself due to the size of the external magnetic field it receives to produce a magnetic field that resists changes in magnetic flux, which can vary over a wide range. If the magnetic field in the space where the electronic compass sensor is located is known, the magnetic field actually measured by the electronic compass sensor is equal to the superposition of the geomagnetic field and the magnetic field generated by the soft iron interference. The soft iron error is equivalent to a time-varying error superimposed on the output of the electronic compass sensor. Because of the different properties of soft magnetic interference error and hard magnetic interference error, the least square method is no longer applicable when compensating soft magnetic interference error. Soft magnetic interference will lead to the deviation of the measurement Angle of the electronic compass. In an ideal environment, the Angle rotated by the measurement of the electronic compass is controllable, but the existence of soft magnetic interference error will lead to the deviation and uncontrollable Angle of the measurement process of the electronic compass. In the application of navigation system, a small Angle difference will lead to a large route error. The modern electronic compass has strong anti-interference and can suppress most of the Angle deviation, but the compensation of soft magnetic error is still worth studying and discussing.

2. Soft magnetic interference error compensation method
In the actual use of electronic compass, the noise errors caused by soft magnetic interference are mostly random noise errors. At present, there are many algorithms that can be used to compensate random noise and most of them are relatively mature, but considering the characteristics of electronic compass requiring real-time and rapid processing of large amounts of data. Three very mature random noise compensation algorithms, namely Kalman filter, improved Sage adaptive Kalman filter and particle filter, are selected as soft magnetic interference compensation algorithms. These three algorithms are easy to implement and can handle dense data.

2.1 Kalman filter
Kalman filtering algorithm can estimate the linear system with Gaussian white noise, which is the most widely used filtering method at present, and has been well applied in the fields of communication, navigation, guidance and control. The basic idea is that the minimum mean square error criterion is the best estimation criterion, and the future state quantity of the system is estimated by recursion theory, so that the estimated value is as close as possible to the real value.

2.2 Adaptive Kalman filtering
Traditional Kalman filter requires that the mean of dynamic noise and observed noise of the system be zero, and the statistical characteristics are known white noise, but these conditions may not be satisfied in practice, so there are modeling errors. Due to the limitation of objective conditions such as computing tools, the filtering algorithm is easy to produce error accumulation when running on the computer. This results in the loss of positivity or symmetry of error covariance matrix and the instability of numerical calculation.

2.3 Particle filter algorithm
The particle filter algorithm originated from the research of Poor Man's Monte Carlo problem in the 1950s, but the first applied particle filter algorithm was proposed by Gordon et al in 1993. The particle filter is based on the Monte Carlo method, which uses sets of particles to represent probabilities and can be used for any form of state-space model. Particle filter can accurately express the posterior probability distribution based on the observed and controlled quantities, and is a sequential important sampling method. Bayesian inference and importance sampling are the basis of understanding particle filtering.

3.Allan variance simulation experiment
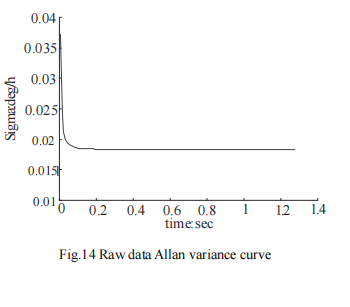
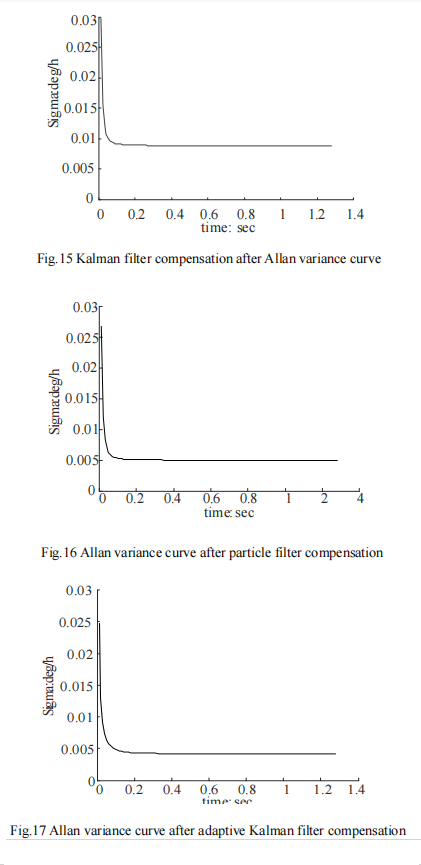
The Allan analysis of variance is used to simulate the original data of random sequence, the data compensated by Kalman filter algorithm, the data compensated by particle filter algorithm, and the four groups of data compensated by adaptive Kalman filter algorithm. Verify the feasibility of Allan variance analysis algorithm. The Allan standard deviation curve of each data is drawn according to the analysis results. The Allan standard deviation curves of the four groups of data are shown in FIG. 14-17 respectively.

Fig 14 Allen variance curve of raw data

The compensated Allen variance curve

4. Summary
From FIG. 14 to FIG. 17, it can be seen that the Allan variance program of the paper can effectively analyze the experimental data.
Several sets of experimental data show that the program is effective.

Different algorithm compensation results

After analyzing the data before and after compensation, it can be seen that the quantization noise and zero bias instability noise of the data after compensation by Kalman filter algorithm are reduced by 64% and 66.4% respectively. The quantization noise and zero bias instability noise of the compensated particle filter data are reduced by 70% and 72.1% respectively. The quantization noise and zero bias instability noise of the data compensated by adaptive Kalman filter are reduced by 91.5% and 75.7% respectively. All the algorithms we mentioned can have a better compensation effect for the original data noise.
It can be seen from the compensation effect that compared with traditional Kalman filter and particle filter, adaptive Kalman filter can better remove the noise in the original data, and filter the noise of ER-EC-385ER-EC-365B and other types of electronic compass. The random data in the simulation experiment is based on the simulation of the noise caused by soft magnetic interference. The simulation results show that the filtering algorithm can compensate the noise of soft magnetic interference. 

Sunday, March 3, 2024

Magnetic Sensitivity of FOG IMU


Inertial measurement unit (IMU) is the key of position and attitude system to obtain high-precision position and attitude information and realize high-precision airborne Earth observation. IMU with high-precision fiber optic gyro (FOG IMU) is sensitive to magnetic field due to Faraday effect of fiber coil, and the performance parameters of FOG zero bias and drift are deteriorated, thus the performance of IMU decreases. For FOG without taking any measures, its zero bias sensitivity is 104 (°)/(h·T), which can meet the requirements of general low-precision inertial measurement systems, but typical high-precision inertial navigation systems (such as POS) require FOG zero bias sensitivity of 1 ~ 10 (°)/(h·T), because of this, to achieve high precision IMU with FOG (FOG IMU), some technical measures must be taken to reduce the magnetic sensitivity of FOG.

1. Methods to reduce magnetic sensitivity
In the development stage of FOG, the technical measures to reduce magnetic sensitivity are mainly depolarization technology and advanced loop winding technology. Single-mode fiber can achieve lower magnetic field sensitivity than the polarization-preserving FOG through depolarization technology. The polarization-preserving gyro can suppress zero drift well because of its large linear bifold beam relative to the circular bifold beam induced by magnetic field. However, the main axis of polarization-preserving optical fiber has slow rotation in the drawing process, and it will also lead to torsion when winding optical fiber coil. Therefore, the Faraday effect in polarization-maintaining fiber is not completely zero. Using advanced winding technology to reduce the residual torsion of the coil and effectively control the tensioning force during the winding process, it can improve the quality of the polarity-maintaining coil and reduce the magnetic sensitivity. In addition, multiple compensators can be configured in the FOG scheme, the combined magnetic sensitivity of the compensators can be used to eliminate the magnetic sensitivity of the coil, and the FOG magnetic sensitivity can be reduced by using a new type of optical fiber with less magnetic sensitivity.

At the application level, the technical measures to reduce FOG magnetic sensitivity are mainly compensation and magnetic shielding. Magnetic sensors (such as fluxgate, etc.) are used to determine the FOG’s magnetic error model in advance through calibration, and then compensation is carried out according to the model in application. However, it is necessary to arrange multiple sensors to fully understand the FOG’s magnetic field condition and add hardware circuits, which makes the system more complicated and affects its reliability. In order to isolate the magnetic field interference in the application environment, the shield with double or multi-layer shield structure is usually designed with μ-alloy material to achieve the maximum attenuation of the external magnetic field, so that although it can achieve better shielding efficiency, it often makes the structure complex, cost and weight increase. In the actual airborne application environment, the IMU based on the high precision FOG will be subject to the complex electromagnetic interference generated by the airborne electronic equipment and the shadow of the geomagnetic field, which will seriously affect its operational precision in the actual work process, and it will also be subjected to the external electromagnetic environment in the calibration test. The shadow affects its test precision. In this paper, the magnetic field sensitivity of high precision optical fiber IMU is studied, the mechanism of FOG’s magnetic field sensitivity is studied, the shielding effect (SE) of the shield is studied with the help of finite element analysis software, and the shield structure is designed. Three FOGs in IMU were screened, and the effectiveness and practicability of the shielding were verified by experiments.

2. Influencing factors of fiber optic gyroscope drift
2.1 Mechanism of influence of magnetic field on FOG

When linearly polarized light passes through the medium along the direction of magnetization or the direction of applied magnetic field, the phenomenon of rotation of the polarization plane is called magneto-optical Faraday effect. In Sagnac ring fiber interferometer, when there is a longitudinal magnetic field parallel to the coil in the plane of the fiber coil, the phase error Δφ generated by two backward linearly polarized beams is twice the Faraday rotation Angle. In practical applications, because the direction and size of the geomagnetic field and the external interference magnetic field are different, and the fiber torsion is distributed along the fiber. In the process of operation, the random stress changes due to temperature variation and vibration and other factors, and can not maintain a constant value, so the phase error of Faraday effect is not a fixed output bias, but a drift of FOG. For the axial magnetic field perpendicular to the optical fiber coil, the theory of the Faraday effect is zero, but in fact, each turn of the optical fiber ring has a small inclination Angle relative to its sensitive axis, when there is an axial magnetic field, it will produce an axial Faraday effect, which makes the FOG show magnetic sensitivity and produce errors.

2.2 Influence of external environment on fog drift
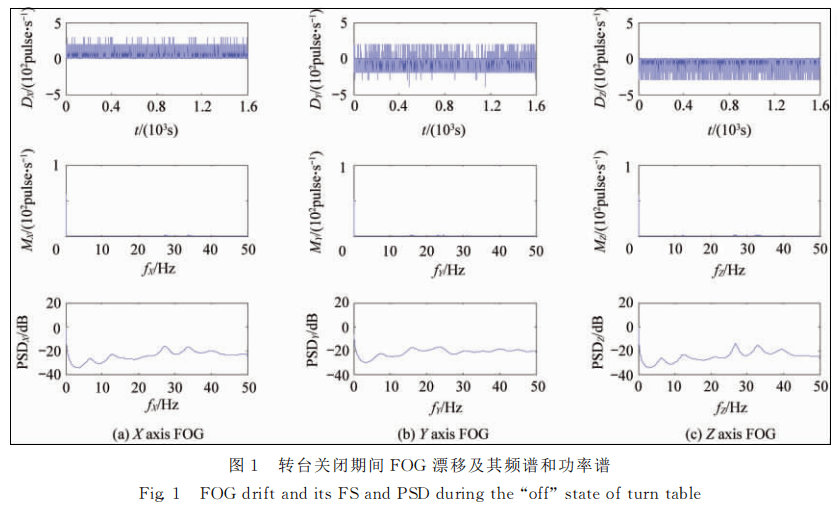
The IMU was installed on the three-axis turntable, and two sets of IMU output data were obtained at the sampling frequency of 100Hz respectively in the off state and the closed state of the turntable. Figure 1 shows the three FOG drifts (DX, DY and DZ, with a single bit of 102 pulse/s, that is, the number of output pulses of 0.01 s) and their spectra (FS, with a amplitude of MX, MY and MZ, with a single bit of 102 pulse/s, respectively) in IMU during turntable shutdown. Frequency classification is fX, fY and fZ, unit is Hz) and power spectrum (PSD, amplitude classification is PSDX, PSDY and PSDZ, single bit is dB). Figure 2 shows three FOG drifts and their frequency spectrum and power spectrum in the IMU during the closing period of the rotary table. The statistical results of FOG drift are shown in Table 1. When the turntable is closed, the FOG data contains frequency components distributed in the band width of 0 ~ 50 Hz. After the turntable is closed, the FOG drift is 5~10 times that of the original. Three main interference frequencies, 12.48Hz, 24.96Hz and 37.44Hz, are introduced.

FOG drift and its FS and PSD during the off state of turn table

3. Summary
We have to take corresponding technical measures to reduce the magnetic sensitivity of FOG, so as to improve the accuracy of FOG IMU.
Ericco’s ER-FIMU-50ER-FIMU-60 and ER-FIMU-70 are all composed of fiber optic gyroscopes. In order to improve the accuracy of FOG IMU, we can completely reduce the magnetic sensitivity of the fiber optic gyroscopes inside (FOG IMU) them by corresponding technical measures.

Friday, March 1, 2024

Static Capacitance Test of MEMS Tilt Sensor


1. Performance test content

The main indicators of the MEMS tilt sensor sensor chip include static capacitance, static performance test and dynamic performance test. The static performance test includes measurement range, sensitivity, linearity, transverse sensitivity and zero stability. The dynamic performance test is mainly the bandwidth test.

1.1 Static capacitance test
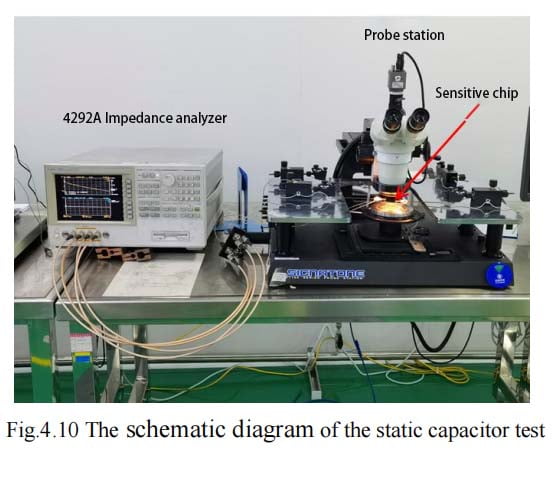
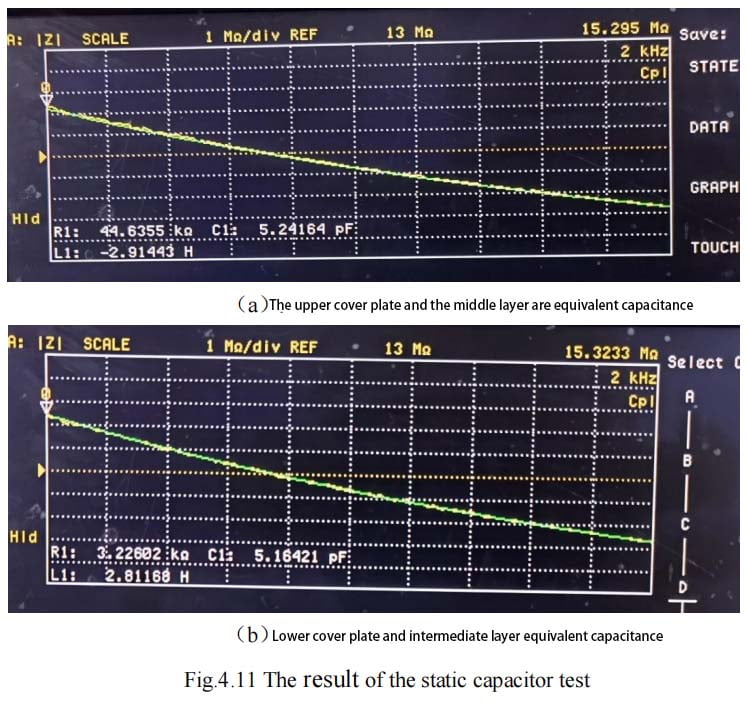
The static capacitance test was performed using wafer probe bench and Agilent 4294A impedance analyzer, as shown in Figure 4.10, mainly for screening MEMS tilt sensor sensitive chips before packaging.

Static capacitance test diagram

The specific steps of static capacitance test are as follows:
(1) The sensitive chip prepared by the lead pad is placed on the table of the probe table in the 0g state;
(2) The measurement mode of the impedance analyzer is set as impedance-frequency test, the sweep frequency range is 2kHz~3kHz, and the excitation source voltage amplitude is 0.5V;
(3) Adjust the two probe bases, and contact the probe with the top cover pad and the middle sensitive structure layer pad respectively to obtain the impedance-frequency test curve, as shown in FIG. 4.11 (a), and obtain the equivalent capacitance by fitting;
(4) Adjust the two probe bases again, and contact the probe with the bottom cover plate of the sensitive chip and the welding pad of the middle sensitive structure layer respectively to obtain the impedance-frequency test curve, as shown in Figure 4.11 (b), and obtain the equivalent capacitance by fitting.
It can be seen from the test that the static capacitance of the middle sensitive structure layer and the upper and lower cover plate of the sensitive chip is 5.24pF and 5.16pF respectively, which has a good symmetry.

Static capacitance test results

1.2 Static Performance testing
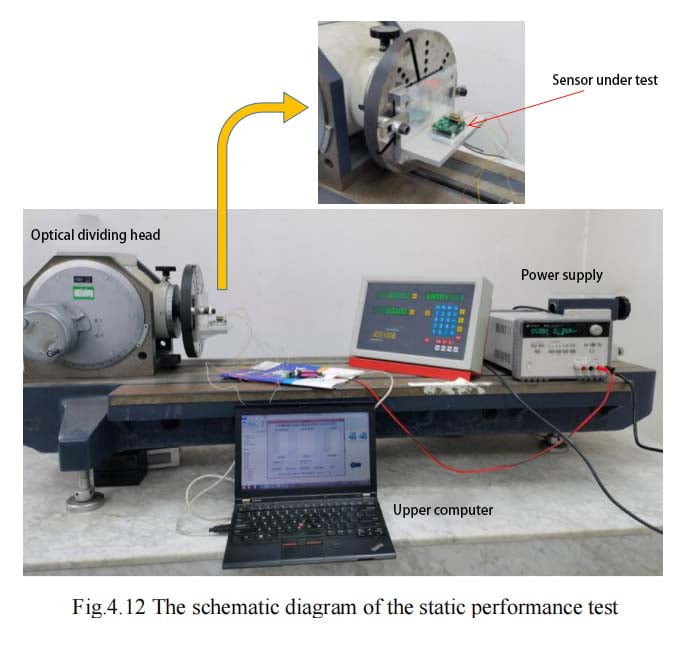
The static performance test of MEMS tilt sensor sensitive chip mainly includes range, sensitivity, linearity, lateral sensitivity and zero stability. The schematic diagram of static performance test is shown in Figure 4.12. Specific test methods and test results are as follows.
(1) Range, sensitivity, linearity test
① Test method
At room temperature in the laboratory, n Angle points are selected at basically equal intervals through the indexing head in the whole measurement range, corresponding to n acceleration value ai. Selection of + 90 ° range – 90 °, 75 °, 60 °, 45 °, 30 °, 15 °, 0 °, 15 °, 30 °, + + + 45 °, 60 ° +, + + 90 ° 75 °,; Plus or minus 30 ° range selection – 30 °, 25 ° ~ 20 °, 15 ° to 10 °, 5 °, 0 °, + 5 °, + 10 °, 15 ° + + 20 °, 25 °, 30 ° + +; ±15° Range selection -15°, -12.5°, -10°, -7.5°, -5°, -2.5°,
0°, +2.5°, +5°, +7.5°, +10°, +12.5°, +15°.
The input acceleration ai and the output value xi are linearly fitted using the least square method, and the fitting line is obtained as follows:

Minor square acceleration and output values

Static performance test schematic

② Test procedure
a. Install the MEMS tilt sensor sensitive chip test board on the precision optical indexing head, ensure that the sensitive direction of the sensitive chip is perpendicular to the rotating shaft of the indexing head, connect the power supply and serial data acquisition line;
b. After the installation is complete, power the test board, stabilize for 10 minutes, and use 0° near the zero position of the sensitive chip
And 180° two-point method to determine the mechanical zero position of the sensitive chip.
c. According to JJF 1427-2013 “Micro-electromechanical (MEMS) line accelerometer calibration specification”, the range, sensitivity,
Linearity test.
③ Test results
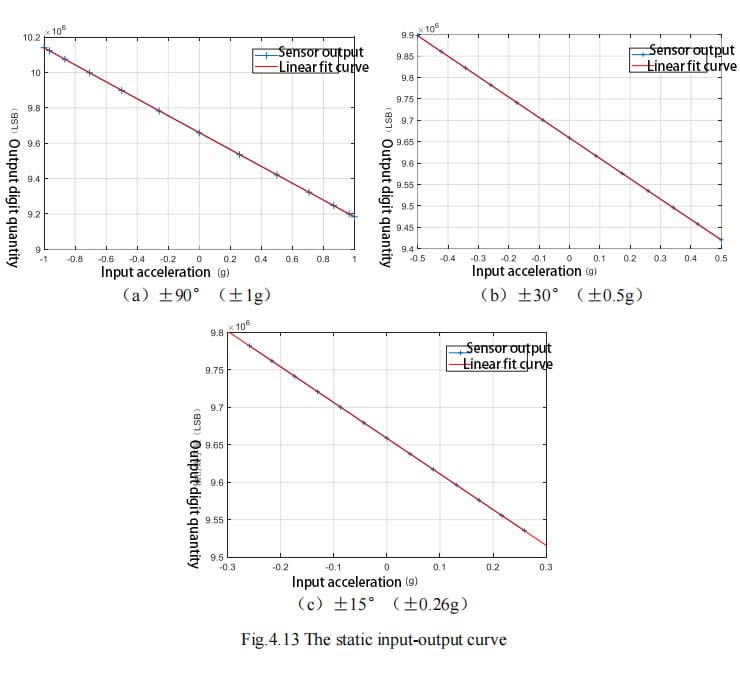
FIG. 4.13 (a) ~ (c) shows the sensitive characteristic curves of the MEMS tilt sensor sensor sensor in the range of ±90°, ±30° and ±15°, respectively. The linear fitting curves and residual errors are obtained by least square fitting of the curves, and the linearity results are obtained by equations (4.4) and (4.5). Detailed test results are shown in Appendix A, Schedule A.1~ Table A.3.

Static input output curve

According to the static input and output curve of the sensor sensor chip, the sensitivity of the sensor sensor chip can be obtained as
477716LSB/g, since the corresponding capacitance range of the AD7745 is ±4pF in the 24-bit digital quantity variation range (16777216 LSB), it is calculated that the actual capacitance-acceleration sensitivity of the sensor sensor chip is about 0.228pF/g. In the range of ±90°, the linearity of acceleration is 0.19%FS, and the linearity of Angle is 0.22°. In the range of ±30°, the acceleration linearity is 0.11%FS and the Angle linearity is 0.06°. The acceleration linearity in the ±15° range is 0.06%FS and the angular linearity is 0.017°. These indexes can meet the requirements of conventional industrial inclination measurement.
(2) Lateral sensitivity test
① Test method
Put the sensor sensitive chip in the horizontal state, coincide with the rotation axis of the indexing head, rotate the indexing head in the clockwise (or counterclockwise) direction, take the equal Angle θ=30°, and test in 7 angular positions, that is, θi=0°, 30°, 60°,…… 180°, record the output value Ei1 at each position and the output value Ei2 at each position when the sensor sensor chip is flipped 180°. The lateral sensitivity of the sensor sensor chip can be obtained according to the formula (4.6).

Lateral sensitivity of sensor sensitive chip

Where, TSR is the cross sensitivity, S is the sensitivity, Ei1 is the output value at θi, Ei2 is the output value after flipping 180° relative to θi, and g is the acceleration of gravity. The maximum TSR calculated is the transverse sensitivity of the sensor sensor chip.
② Test procedure
a. Install the MEMS tilt sensor sensitive chip test board on the precision optical indexing head, ensure that the sensitive direction of the sensitive chip coincides with the rotation axis of the indexing head, and connect the power supply and serial data acquisition line;
b. After installation, supply power to the test board, stabilize for 10 minutes, and determine the mechanical zero position of the sensitive chip by using the 0° and 180° method near the installation zero position of the sensitive chip.
c. Perform lateral sensitivity test according to JJF 1427-2013 “Microelectromechanical (MEMS) Line accelerometer Calibration Specification”.
③ Test results
According to the above test methods and test steps, the lateral sensitivity of the MEMS tilt sensor sensor chip can be obtained
The degree is 5.2%FS, and the specific test data are shown in attached Table A.4. The index is still not ideal, the main reason is that the current package shell size is large, the sensitive chip mounting no reference, it is easy to lead to mounting deviation Angle, resulting in sensitive direction sensitivity of the sensitive chip leakage in the non-sensitive direction, which has a direct impact on the horizontal sensitivity index.
(3) Zero stability test
① Test method
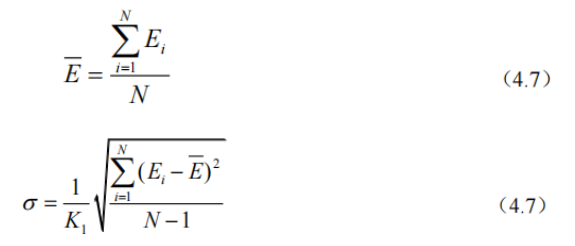
Set the sensitive direction of the sensor sensor chip to the horizontal state, coincide with the rotation axis of the indexing head, and record the output value of the prototype E1, E2, E3,…… EN, calculate the zero stability of the sensitive chip according to formulas (4.7) and (4.8).

Calculate the zero stability of the sensitive chip

Where, K1 is the sensitivity of the sensor sensitive chip, which is 477716LSB/g according to the previous test results, and σ is zero stability.
② Test procedure
a. Install the MEMS tilt sensor sensitive chip test board on the precision optical indexing head to ensure the sensitive chip
The sensitive direction is perpendicular to the rotating shaft of the indexing head, and the power supply and serial data acquisition line are connected.
b. After installation, supply power to the test board, stabilize for 10 minutes, and determine the mechanical zero position of the sensitive chip by using the 0° and 180° method near the installation zero position of the sensitive chip.
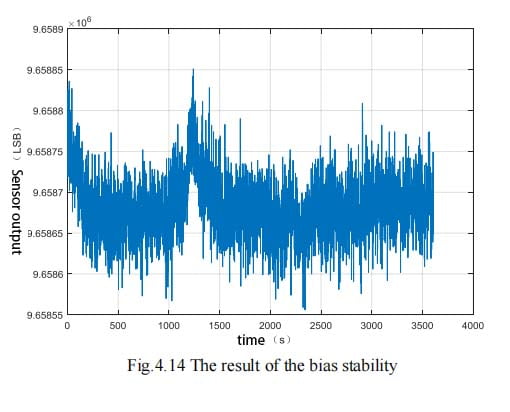
c. Conduct zero stability test according to JJF 1427-2013 “Micro-electromechanical (MEMS) Line Accelerometer Calibration Specification”, test time 1h.
③ Test results
The test results of zero stability are shown in Figure 4.14

Zero stability test results

2. Summary
The calculation shows that the 1h zero stability of the sensor chip is about 81.3μg, which can meet the requirements of conventional industrial inclination measurement. Ericco’s ER-TS-3160VO and ER-TS-4158CU, which we have tested for static performance, have a high level of protection and can work in harsh industrial environments for a long time. 

RTK signal is easily blocked? IMU makes RTK have unlimited possibilities

When you use an RTK surveying instrument to measure in some places with obstructions or requiring a large tilt, do you always encounter weak...